Figure 4. The angiogenic effect of IFNγ
was through the PI-3K/mTOR translational pathway. A: ARPE-19
cells
were cultured with or without IFNγ in the presence or absence of
LY294002 for 15, 30, and 60 min. Cells were collected and processed for
western blot analysis using anti-p-p70 S6 kinase, anti-p-S6 ribosomal
protein, anti-p-4E-BP1, p-akt, and GAPDH antibodies. B: ARPE-19
cells were cultured with or without IFNγ in the presence or absence of
LY294002 for 15, 30, and 60 min. Cells were collected and processed for
western blot analysis using anti-p-akt, anti-p-Stat1, and GAPDH
antibodies. The results were representative data from two separate
experiments. C: ARPE-19 cells were cultured with or without
IFNγ/LY294002 for 24 h. Cells were collected for RNA purification.
Real-time PCR assay was performed, and the results were expressed as
the n-fold expression of hVEGF normalized on that of GAPDH or 18S rRNA.
D: ARPE-19 cells were cultured with or without IFNγ/PI-3K
inhibitor LY294002 for 48 h. Cell supernatants were collected and used
for ELISA analysis. The y-axis represents VEGF concentration (pg/ml).
The values are expressed as the average±SEM of triplicates of each
treatment. The double asterisk indicates statistical significance
(p<0.01) compared to the IFNγ group. E: ARPE-19 cells were
mock-transfected or transfected with SiRNA of akt. After 2 days, cells
were then collected and processed for western blot analysis for akt
expression. The same blot was also stained with GAPDH antibody as a
loading control. The results were representative data from two separate
experiments. F: ARPE-19 cells were mock-transfected or
transfected with SiRNA of akt. Two days later, cells were treated with
or without IFNγ for 48 h. Cell supernatants were collected and used for
ELISA analysis. The y-axis represents VEGF concentration (pg/ml). The
values are expressed as the average±SEM of triplicates of each
treatment. The double asterisk indicates statistical significance
(p<0.01) compared to the IFNγ group.
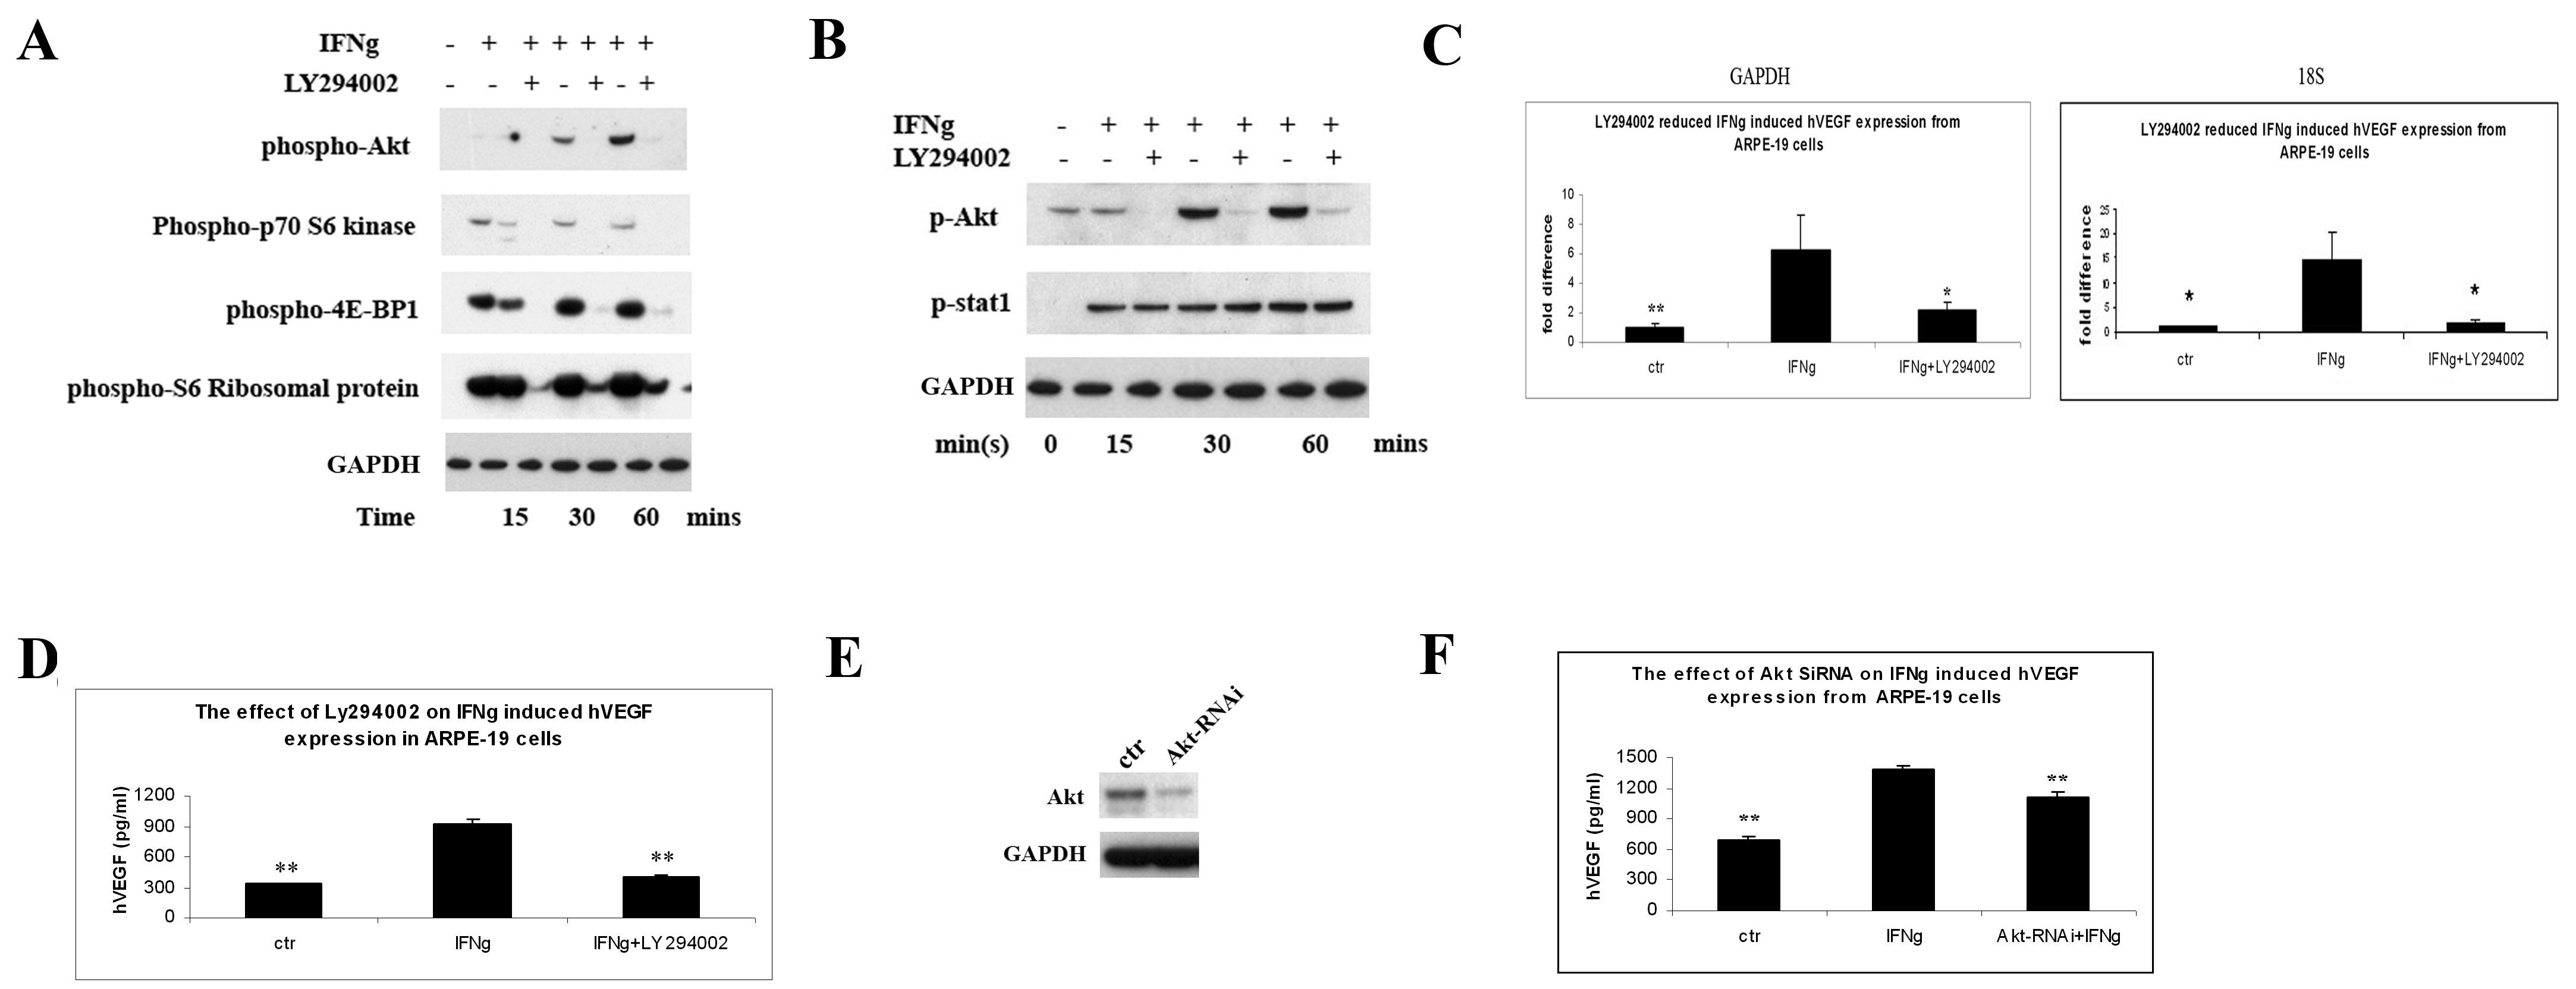
 Figure 4 of Liu, Mol Vis 2010; 16:184-193.