Figure 1. Network of the upregulated genes
in the normal corneal epithelial tissue (p<0.01) after Bonferroni
correction. Each box represents a gene; black edges represent
co-citation and green edges indicate the binding of specific
transcription factor on the gene promoter.
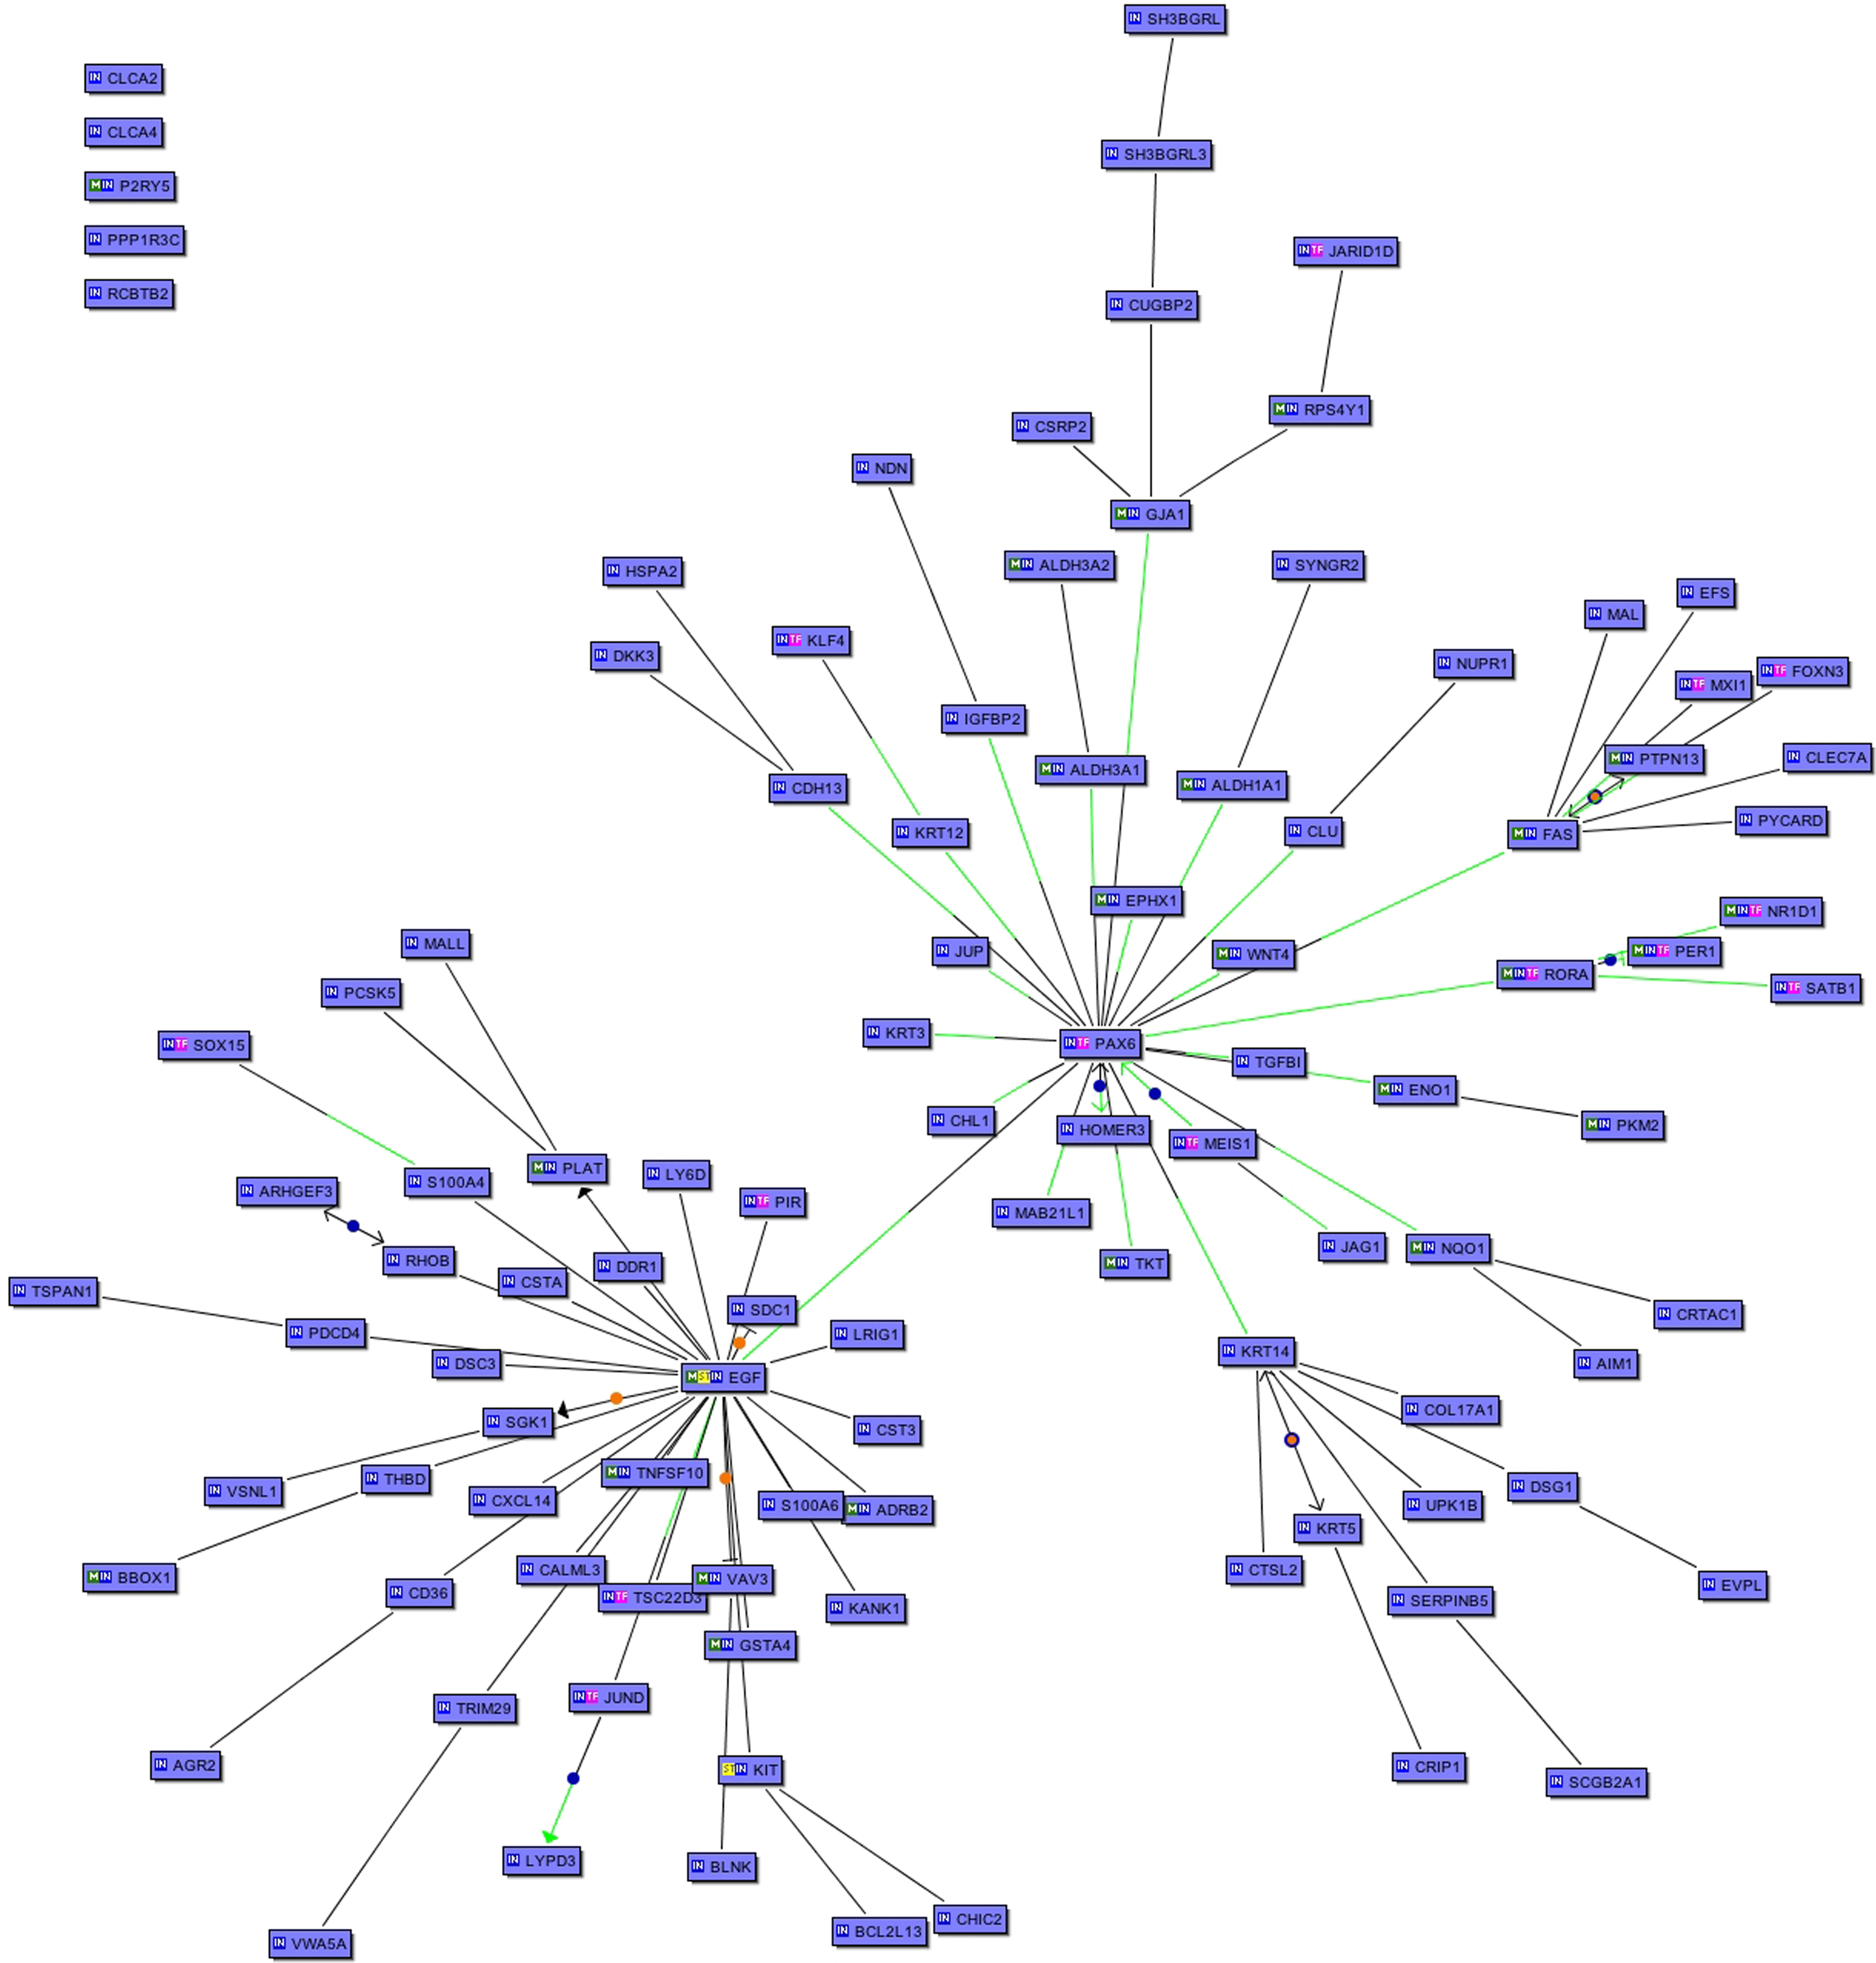
 Figure 1 of Greco, Mol Vis 2010; 16:2109-2120.