Figure 2. Volcano plot of the gene
expression changes in the canine glaucomatous retina. Negative
expression changes denote transcripts detected at reduced levels in
glaucomatous eyes. This plot also represents all expressed genes,
including those with less than twofold expression changes. Vertical
bars represent a twofold expression change. Probability values were
derived by Student’s t-test.
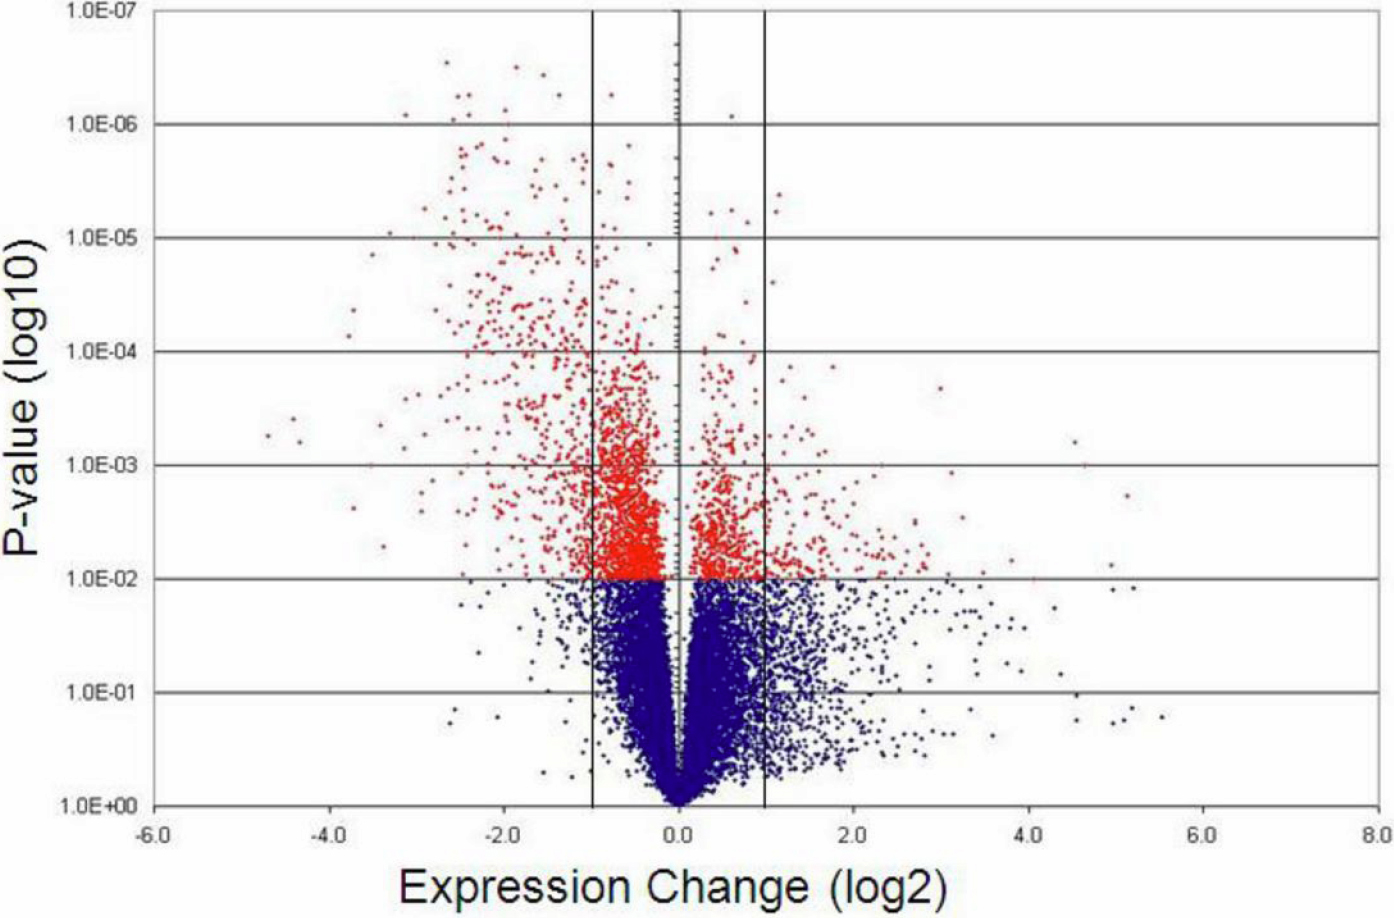
 Figure 2 of Jiang, Mol Vis 2010; 16:2092-2108.