Figure 2 of
Li, Mol Vis 2010; 16:2084-2091.
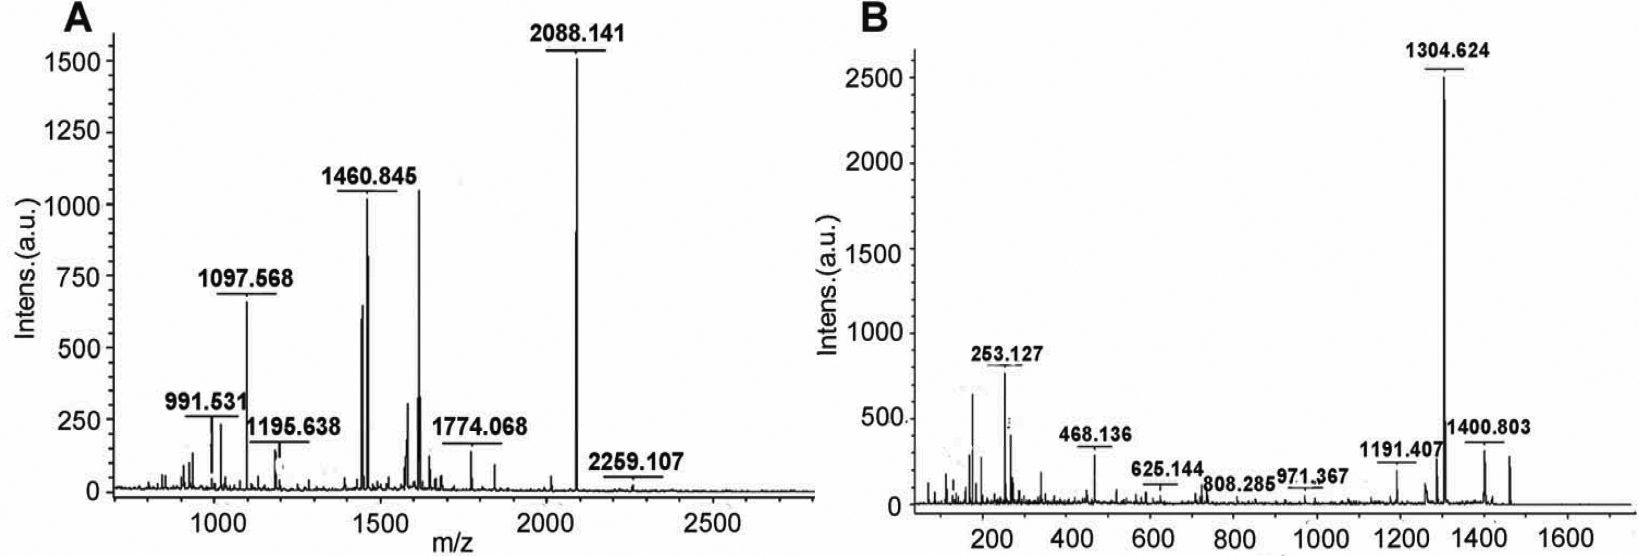
Figure 2.
The MALDI-TOF/TOF spectrum analysis of band 3 identified as lactoferrin (gi|38154680).
A
: The PMF (Peptide Mass Fingerprint) signals.
B
: The MS/MS spectra corresponding to one of the parent ions (1460.8448).
 Figure 2 of Li, Mol Vis 2010; 16:2084-2091.