Figure 7. Pedigree and haplotype analysis of Family YT at the FEOM1 and FEOM3 loci. Black symbols identify clinically affected individuals.
Genotyping data and schematic haplotype bars for FEOM1 markers (A) and FEOM3 markers (B) are shown below the symbol for each individual. The black bars denote the potential disease-associated alleles. The white
bars indicate the inheritance of non disease-associated haplotypes.
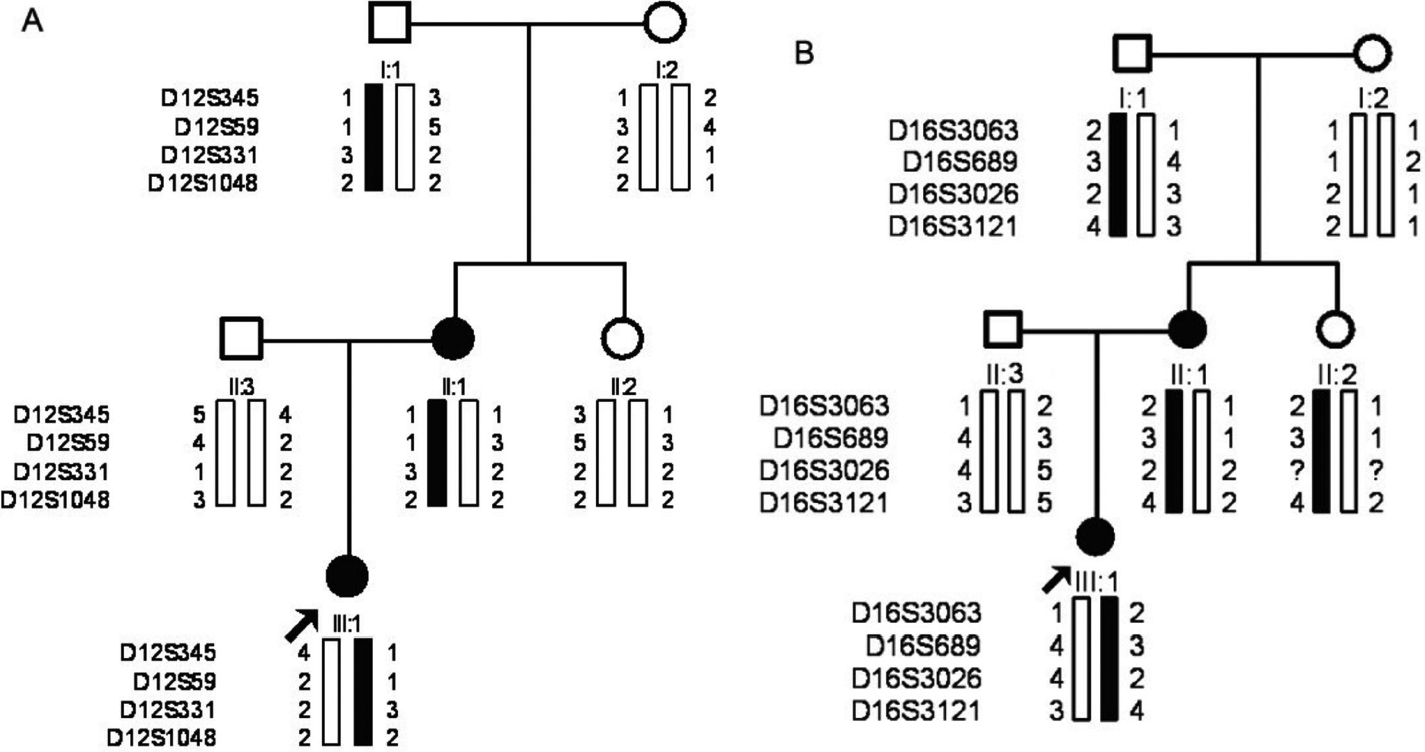
 Figure 7 of
Yang, Mol Vis 2010; 16:2062-2070.
Figure 7 of
Yang, Mol Vis 2010; 16:2062-2070.