Figure 4. Western-blot analysis of the
identified proteins showing a significant decrease in protein
expression of zinc-α2-glycoprotein (ZAG), lactoferrin, and IGKC
(immunoglobulin kappa chain) in KC patients compared to control
subjects. O.D.: optical density; A.U.: arbitrary units; GAPDH:
glyceraldehyde-3-phosphate dehydrogenase; *p<0.05 versus control
subjects.
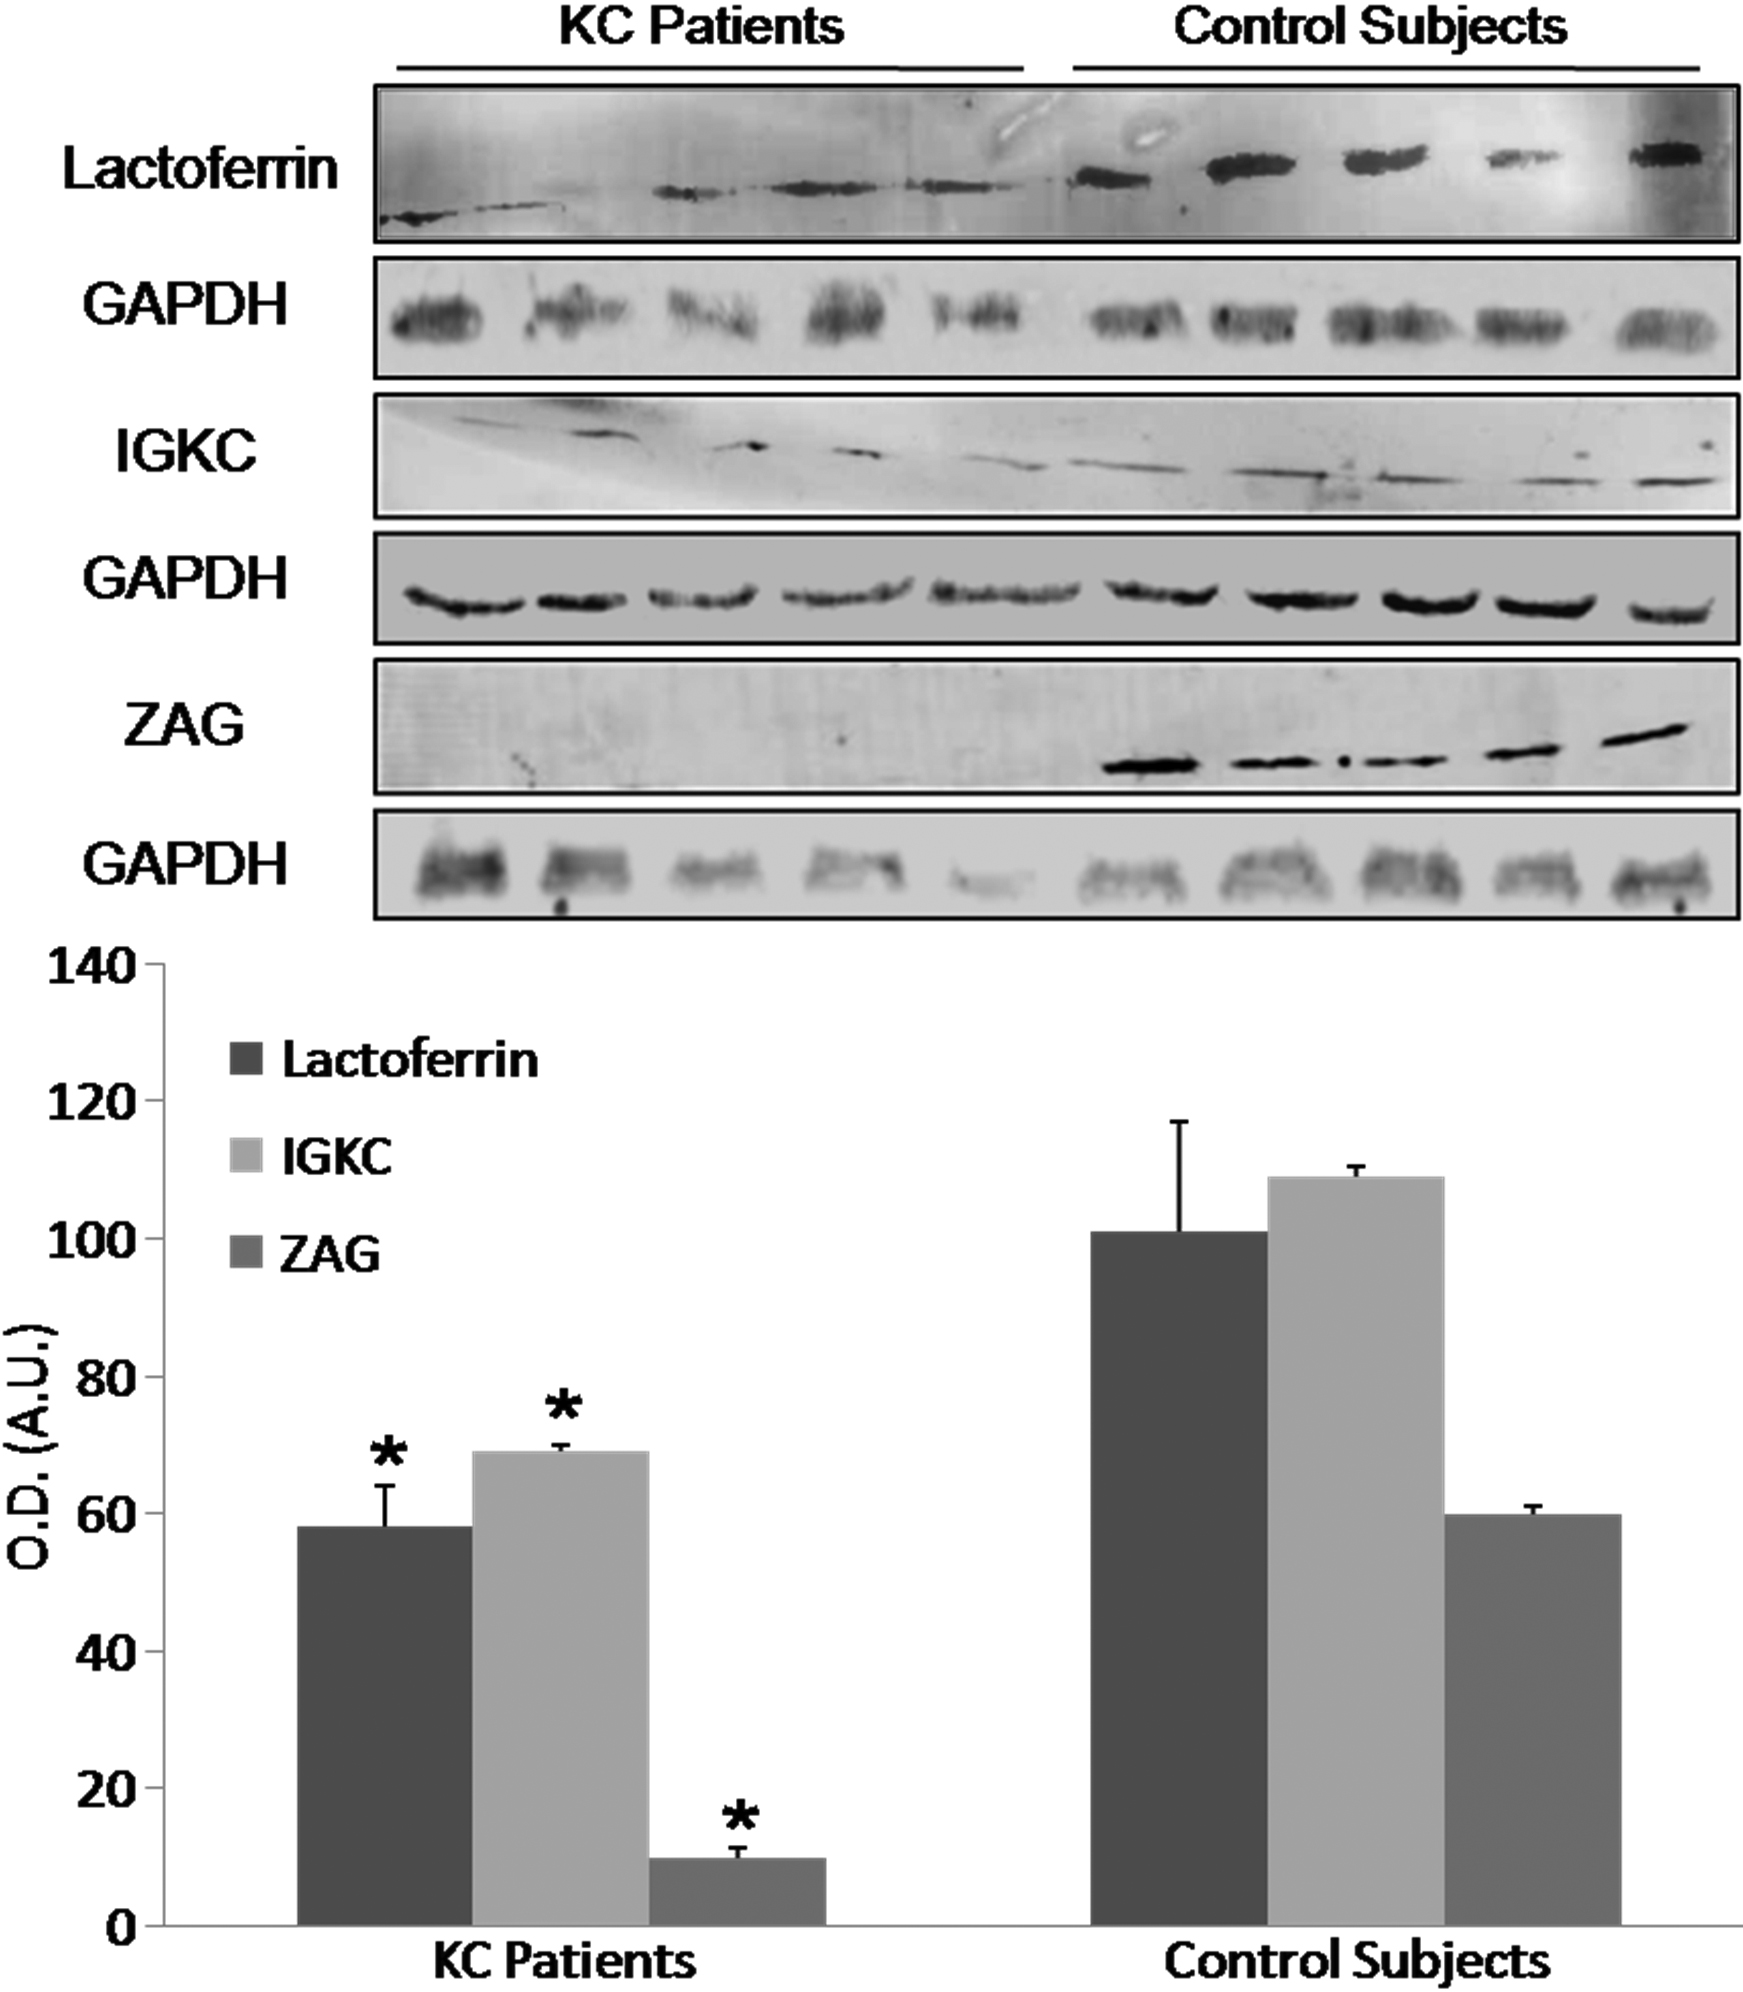
 Figure 4 of Lema, Mol Vis 2010; 16:2055-2061.