Figure 2. OPA1 mutation in the
Autosomal Dominant Optic Atrophy (ADOA) family. A shows the
agarose gel of products from polymerase chain reaction (PCR) of exon 8.
Lane 1 is patient sample (V-3), lanes 2 and 3 are normal controls, lane
4 is patient’s mother (IV-8). B shows comparison of sequences
of allele with Alu insertion and normal allele. Exon sequence is shown
in bold and highlighted in sky blue; direct repeats flanking the Alu
insertion are shown in bold and underlined; Alu element with poly(A)
tail is highlighted in yellow; arrows in the normal sequence indicate
the cuts. C shows complementary and reverse sequence of mutated
region in OPA1 gene with sequence elements of the Alu repeat.
Consensus target site is shown in red bold characters and underlined;
target-site duplications of the OPA1 gene sequence flanking the
integrated DNA are highlighted in sky blue; A and B box sequences (RNA
polymerase III promoter) are highlighted in green and violet,
respectively; poly(A) tail is highlighted in yellow. D shows
the agarose gel of products from reverse transcription–PCR of exons
6–10 of the OPA1 gene. Lane 1 is patient sample (V-3), lanes 2,
3, and 4 are normal controls. E shows electropherogram section
with the skipping of exon 8.
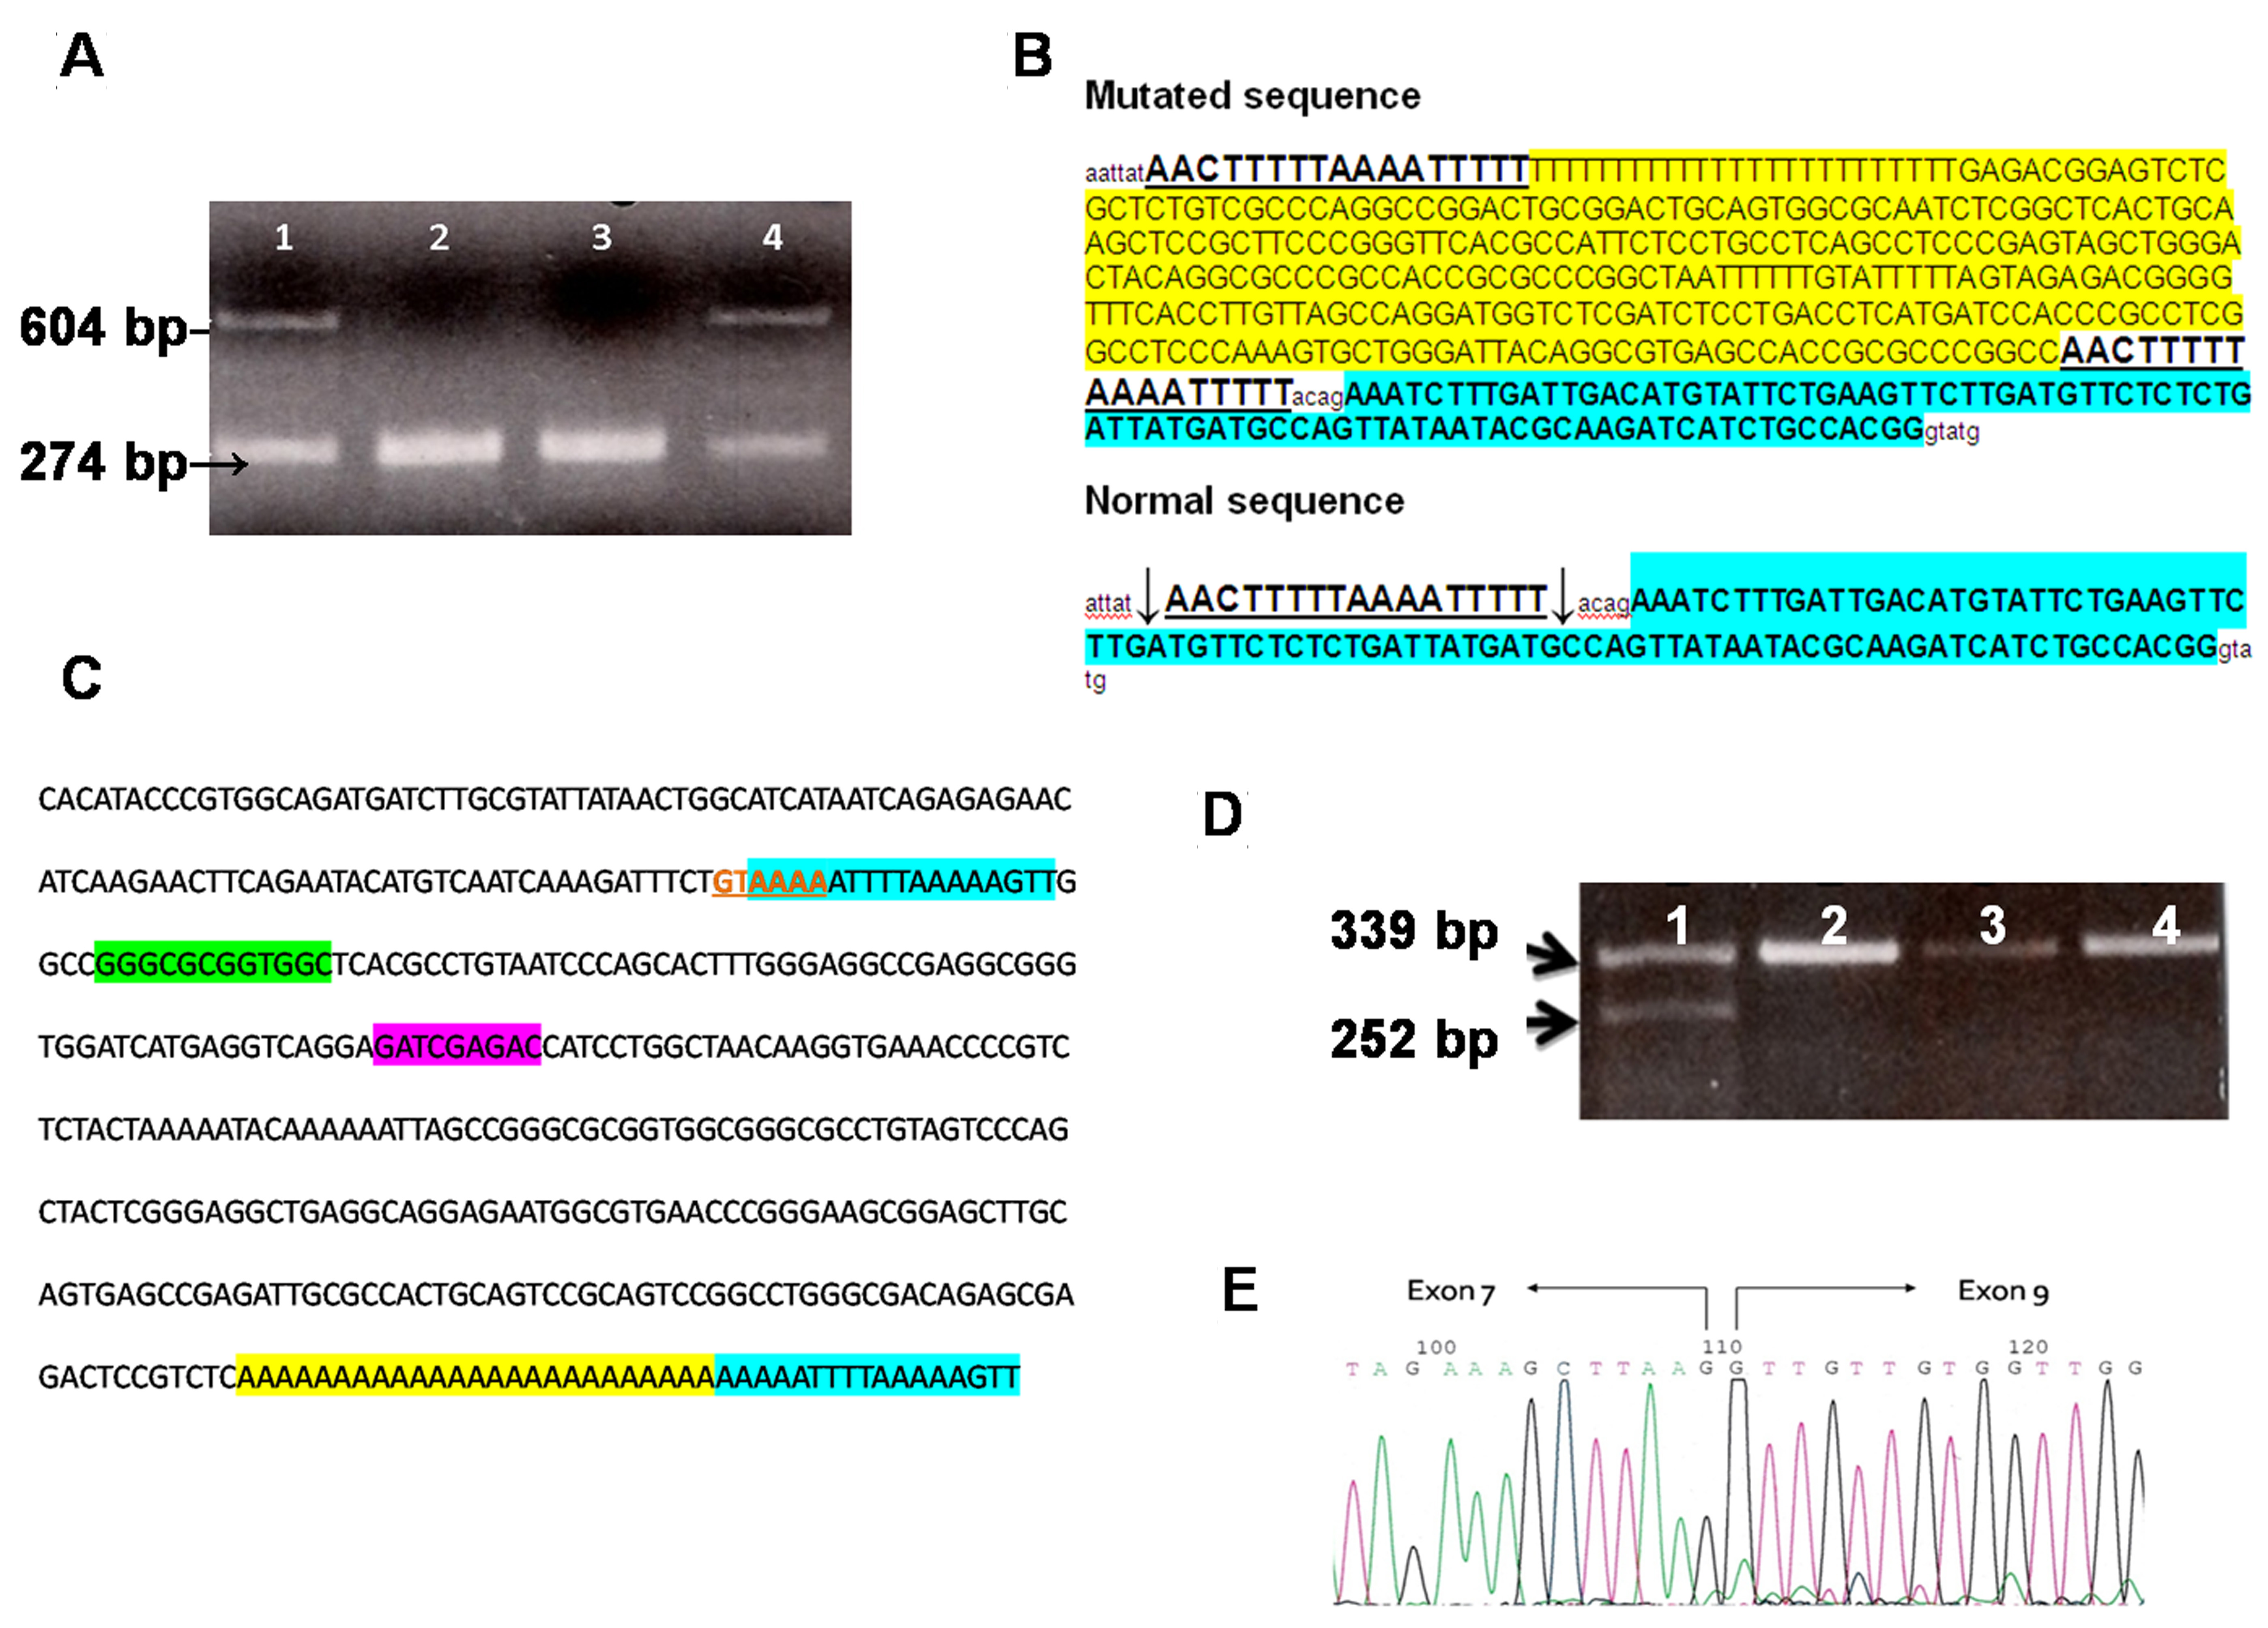
 Figure 2 of Gallus, Mol Vis 2010; 16:178-183.