Figure 2. Accumulation of glycated albumin
in diabetic retina and its inflammatory potential for microglia cells. A:
Glycated
albumin expression in normal, 2-weeks diabetic rats, and 12.5
ng of glycated albumin product (Sigma), analyzed by western blot using
mouse monoclonal antibody A717. The mean ratio±SD of the intensity of
glycated albumin versus actin was indicated below each group. The ratio
of normal, non diabetic rats was taken as 1.0. B:
Dose-dependent release of tumor necrosis factor α (TNF-α) in glycated
albumin-treated microglial cells. Microglial cells were stimulated with
10, 50, 200, 500 µg/ml glycated albumin for 4 h. TNF-α levels assayed
by enzyme-linked immunosorbent assay (ELISA) in culture supernatant
were compared with corresponding dosage of non-glycated albumin-treated
cells and are expressed as means±SD for three independent experiments.
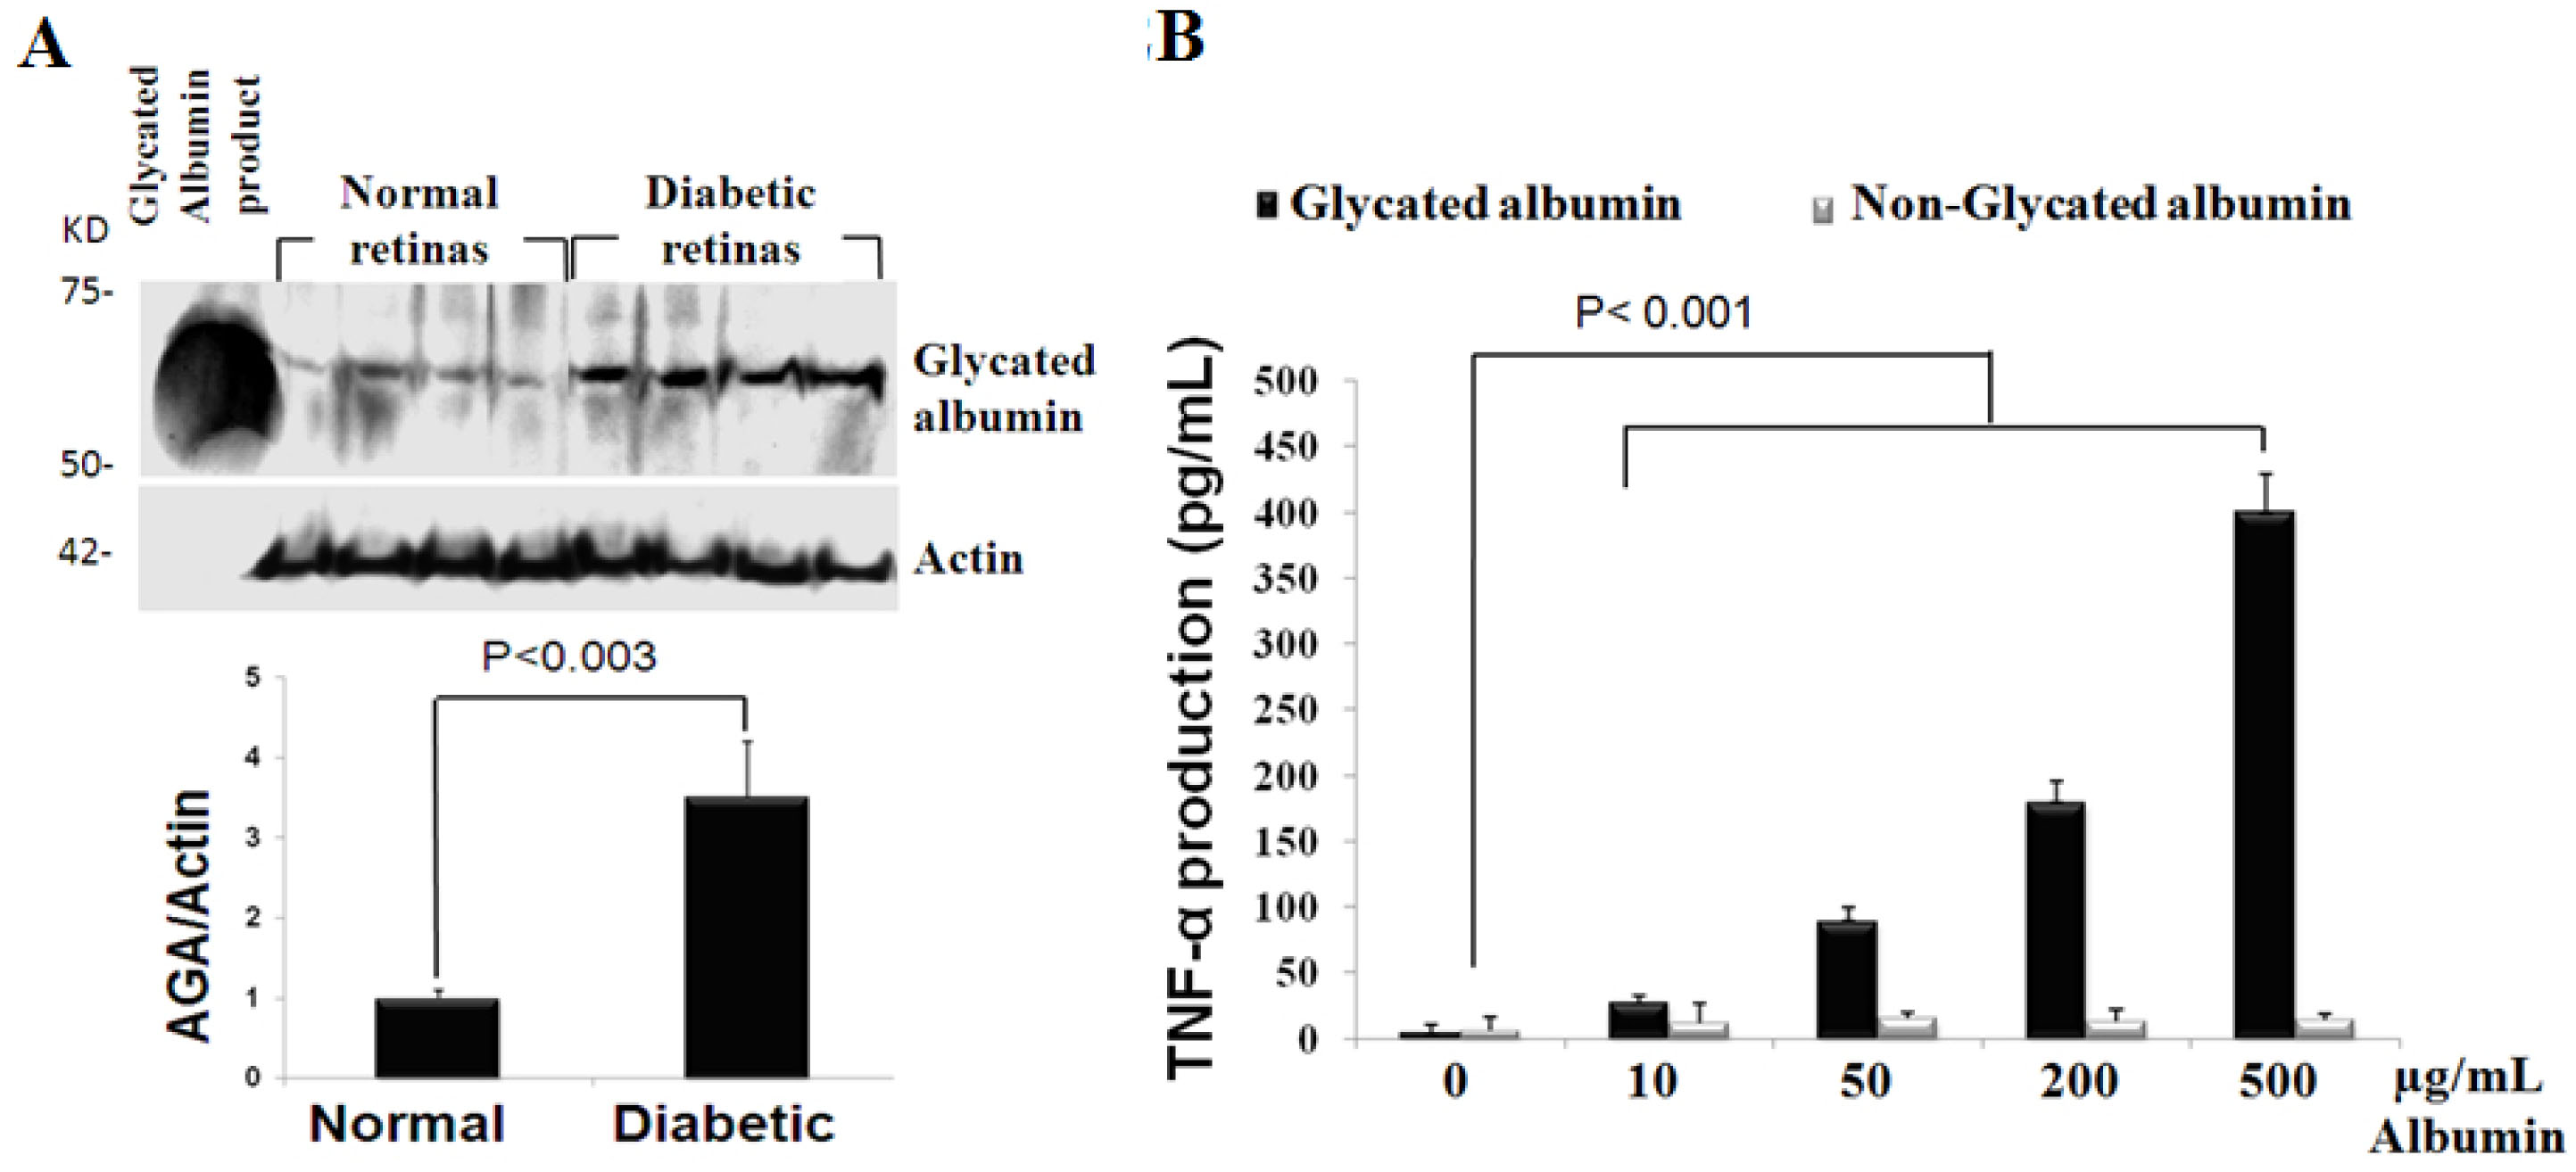
 Figure 2 of Ibrahim, Mol Vis 2010; 16:2033-2042.