Figure 1. Effect of intravitreally
injected genistein on Streptozotocin (STZ)-induced retinal inflammation
and microglial activation. 2-weeks diabetic rats were treated with
genistein (50 µM) or vehicle (0.05% DMSO) intraocularly. 48 h later
rats were killed and their retinal and vitreal samples were processed
for Quantitative Real Time-PCR (qRT–PCR) and enzyme-linked
immunosorbent assay (ELISA) analyses, respectively, (n=6). A:
qRT–PCR analysis for TNF-α expression in diabetic rat retinas
after 48 h treatment with genistein or vehicle intraocularly. The level
of gene expression was presented as the mean fold change±SD relative to
normal non-diabetic rats. B: ELISA analysis of vitreal TNF-α
release in vitreous and expressed as absolute value±SD C:
Representative images show the colocalization of TNF-α with glial
markers in the retina of 2-weeks diabetic rats. Iba-1 (red), a marker
of activated microglia; glial fibrillary acidic protein (GFAP; red), a
marker of astrocytes or activated Müller cells. Yellow displayed from
merged red and green. Scale bar represents 20 μm. Abbreviations:OPL
indicates outer plexiform layer; GCL indicates ganglion cell layer;
(magnification, 200×). D: Effect of intravitreally injected
genistein on microglial activation assayed by Iba1 mRNA
expression using qRT–PCR. The level of gene expression was presented as
the mean fold change±SD relative to normal non-diabetic rats.
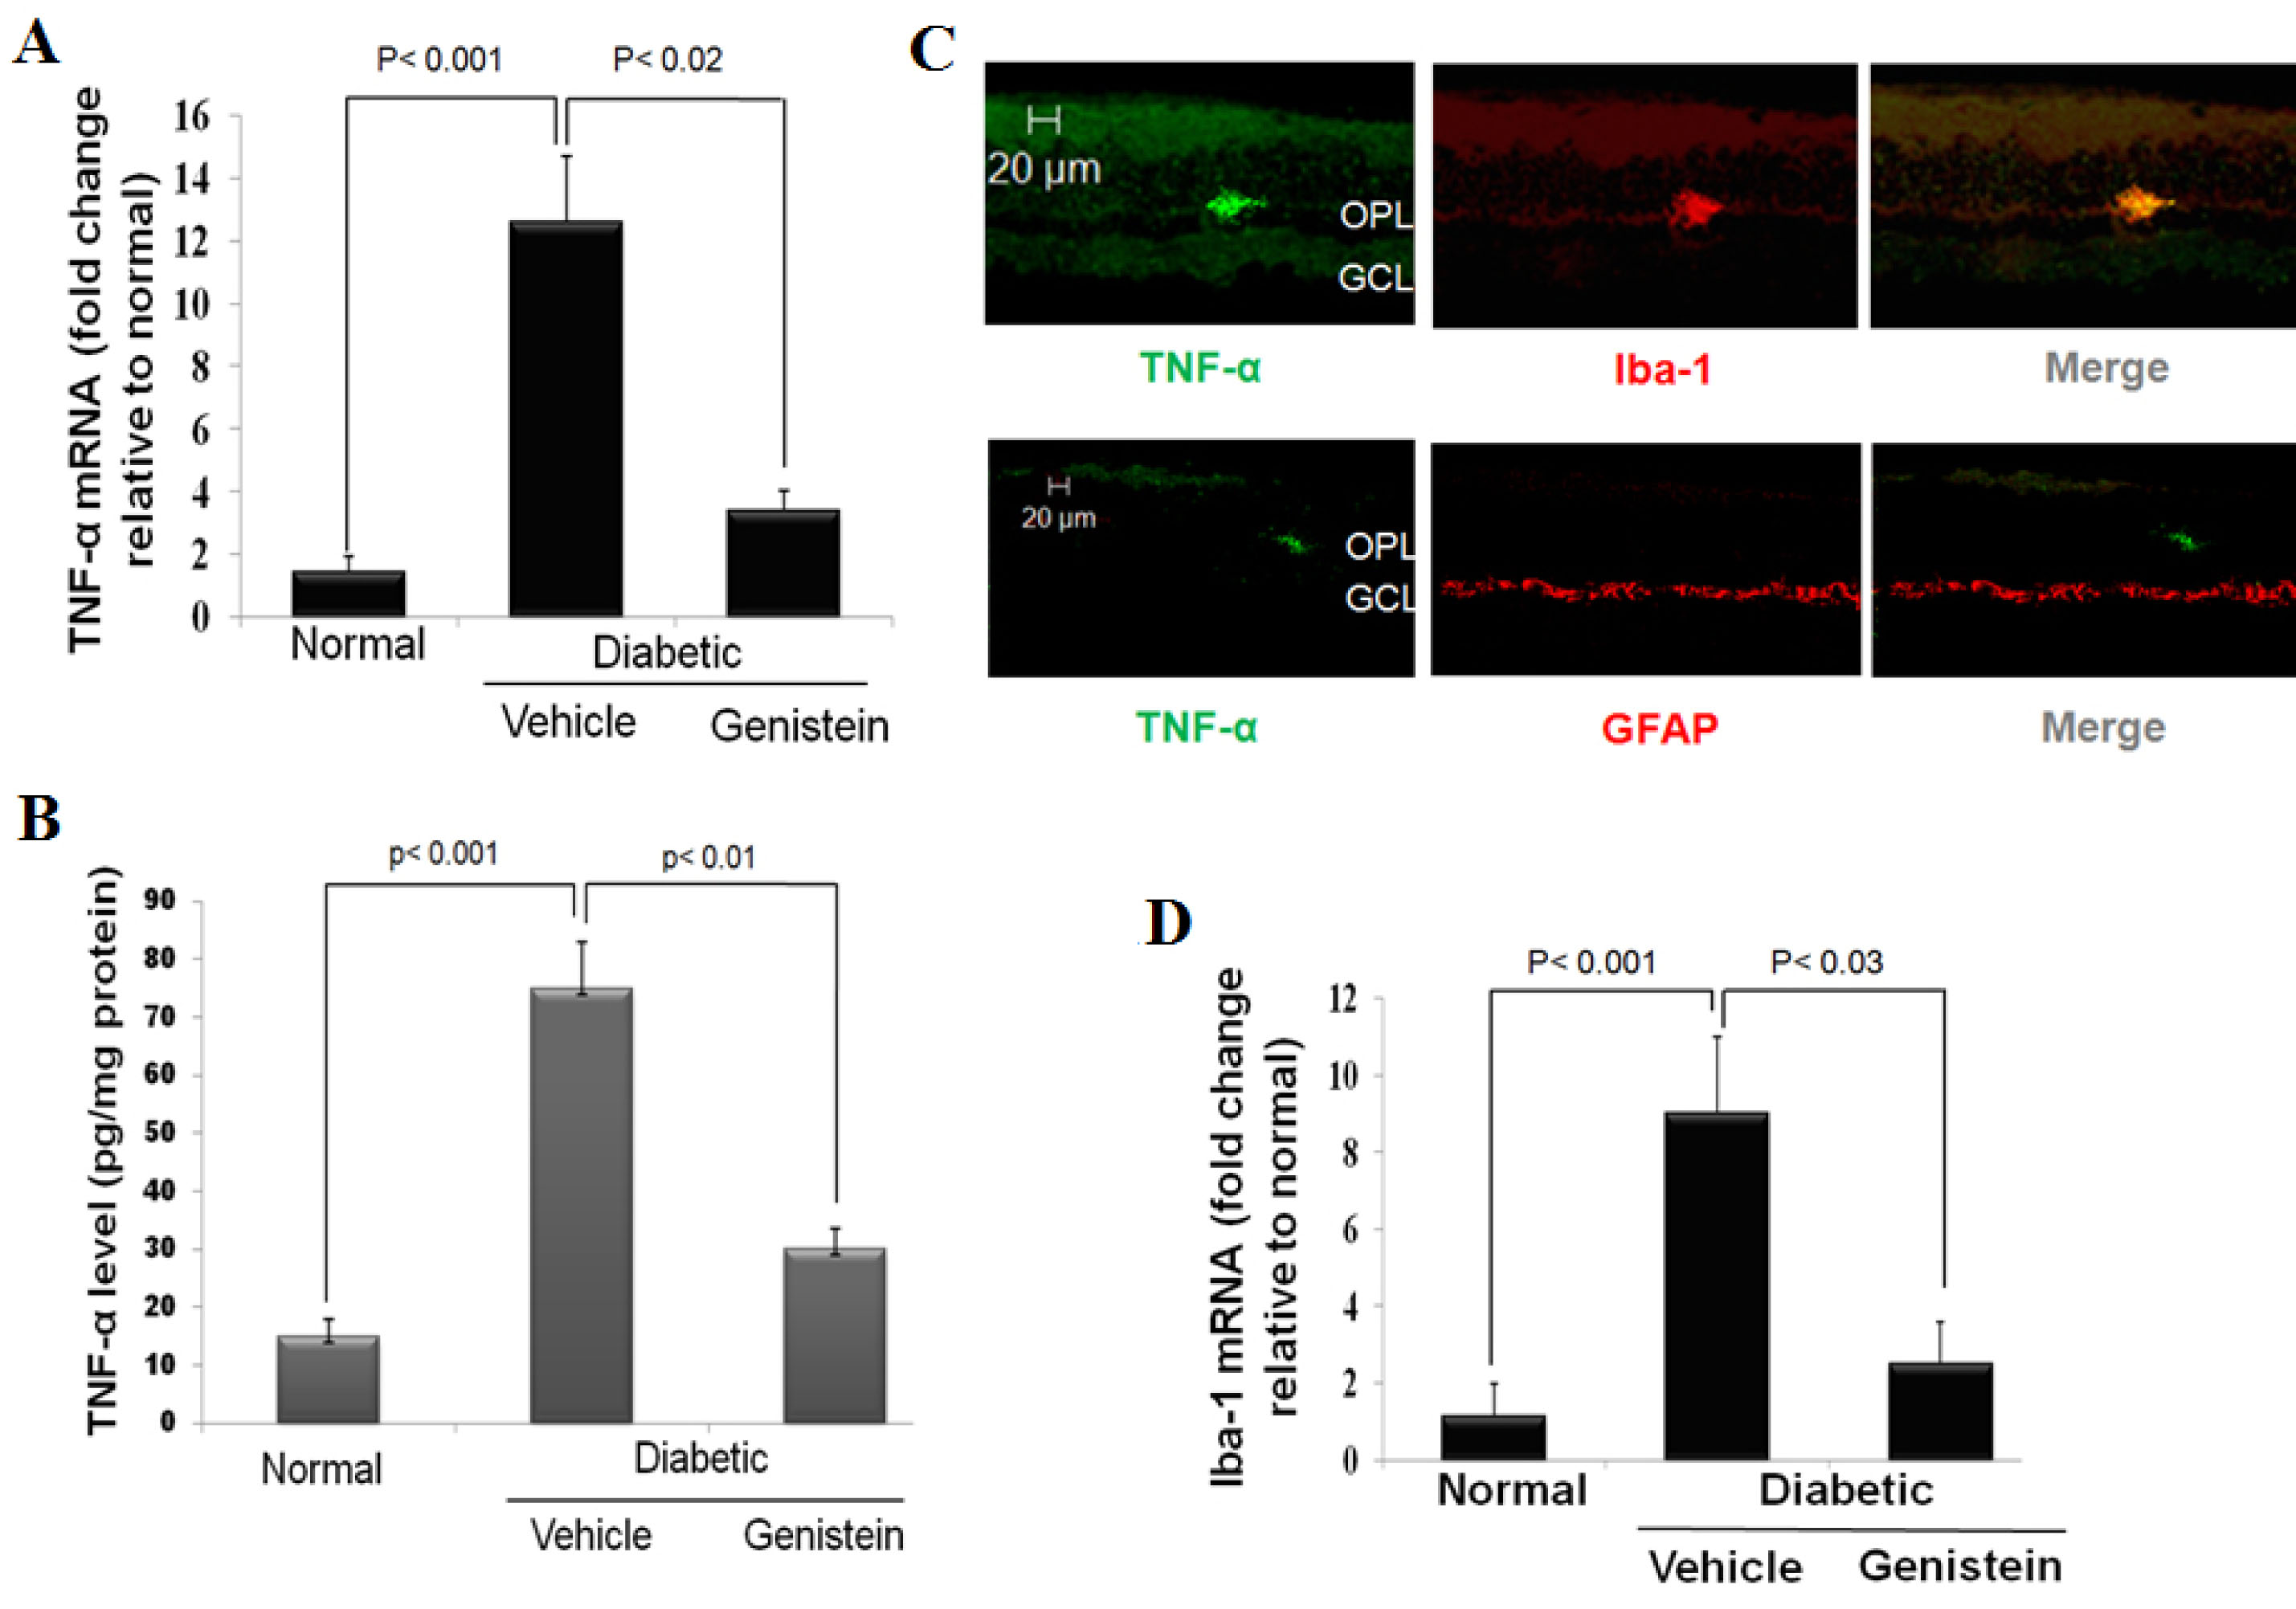
 Figure 1 of Ibrahim, Mol Vis 2010; 16:2033-2042.