Figure 1. The relation between the IOP and flare and the IOP and cell in the APACG and CPACG group. A: The flare was positively related with the intraocular pressure (IOP) in the acute primary angle closure glaucoma (APACG)
group (r=0.527, p<0.001). B: The cell was positively related with the IOP in the APACG group (r=0.775, p<0.001). C: There was no significant correlation between the IOP and flare in the chronic primary angle closure glaucoma (CPACG) group
(r=0.131, p=0.408). D: There was no significant correlation between the IOP and cell in the CPACG group (r=0. 158, p=0.336).
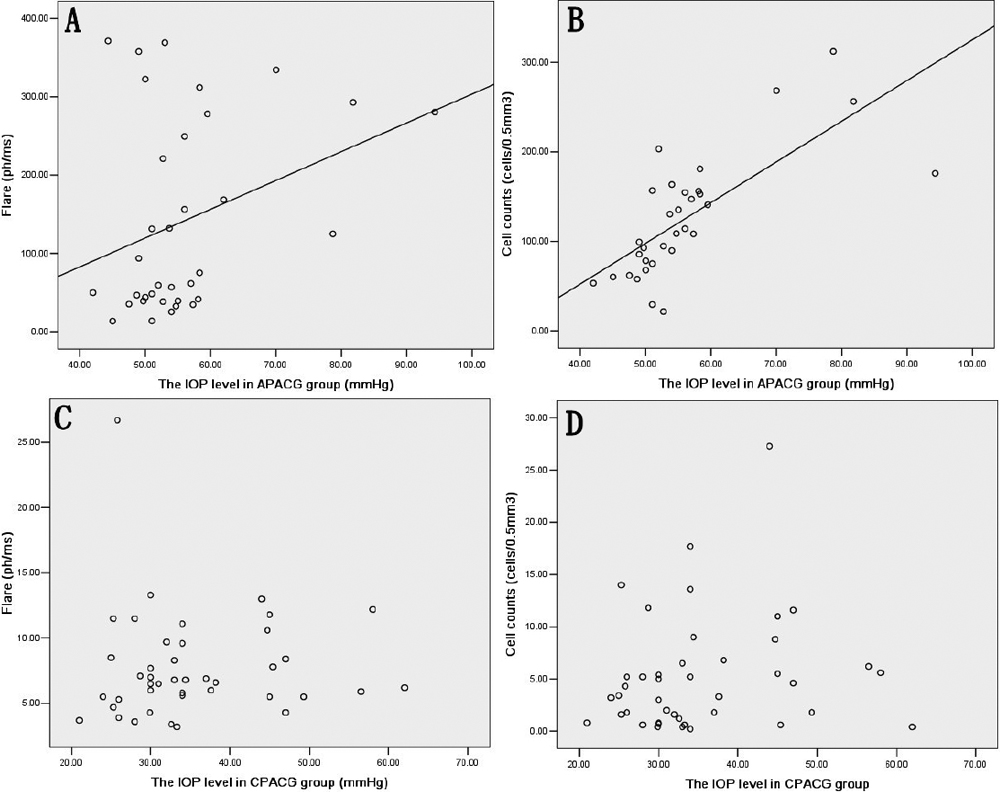
 Figure 1 of
Kong, Mol Vis 2010; 16:2026-2032.
Figure 1 of
Kong, Mol Vis 2010; 16:2026-2032.