Figure 3. Copy number of the SPARC
gene in the family members from the Philippine pedigree and the
randomly selected Chinese JPOAG patients and controls. Each bar
represents the copy number prediction of the target sequence in each
subject. And each color presents each copy number assay. Thus, each
individual is represented by three bars. The red arrow indicates the
reference line for two copies. One sample (G1070) was predicted to have
a copy number of 3 but with a confidence of <50%.
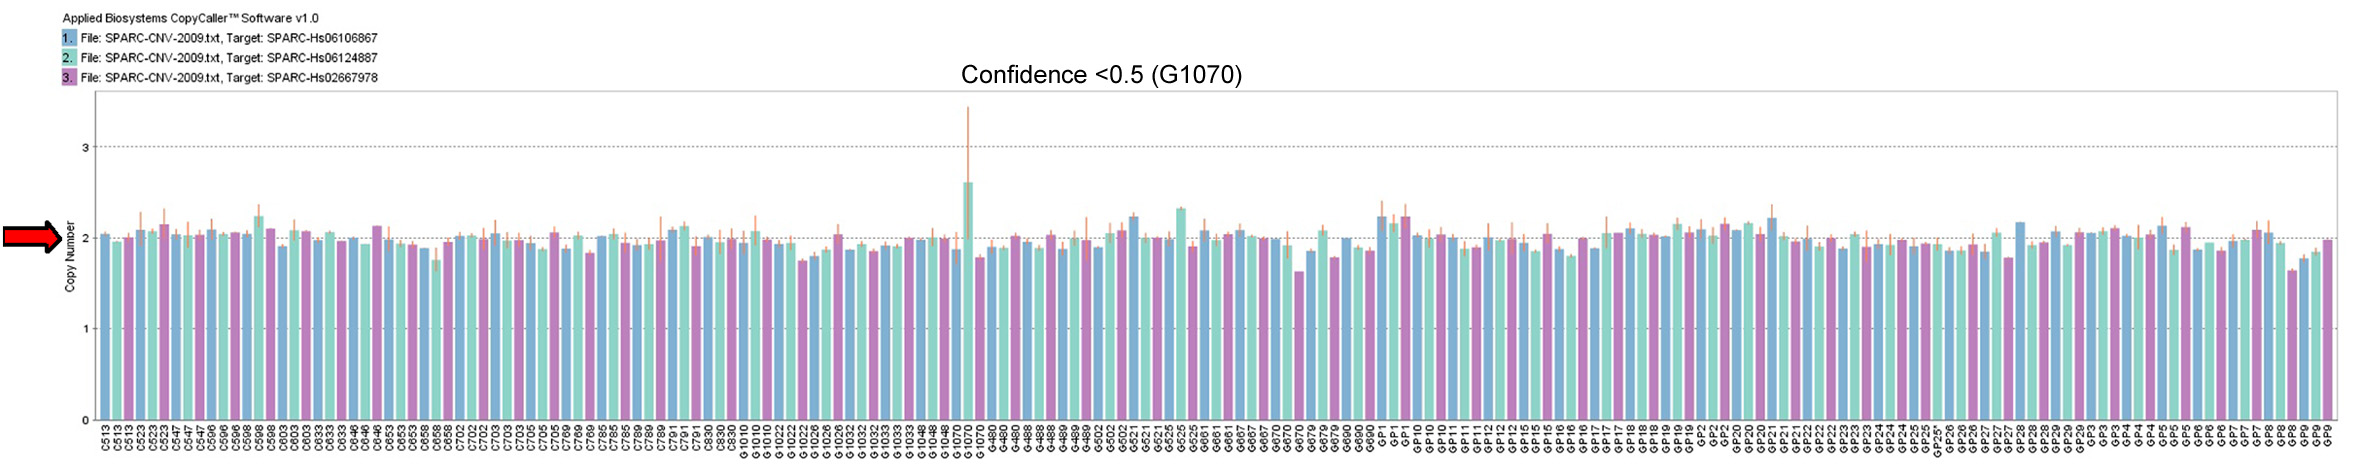
 Figure 3 of Chen, Mol Vis 2010; 16:2016-2025.