Figure 2. Linkage disequilibrium and haplotype association analyses for the SPARC variants detected in this study. A: Linkage disequilibrium plot of 11 SNPs of the SPARC gene in the combined subjects. D' values corresponding to each SNP pair are expressed as a percentage and shown within the
respective square. The five most common SNPs constitute a haplotype block spanning from intron 3 to the 3′-UTR of the gene.
B: Haplotype-based association analysis of the 5 most common SNPs in the LD block with JPOAG. The frequencies of each haplotype
in the patient and control groups were presented in percentage. Only those haplotypes with frequencies >1% were shown.
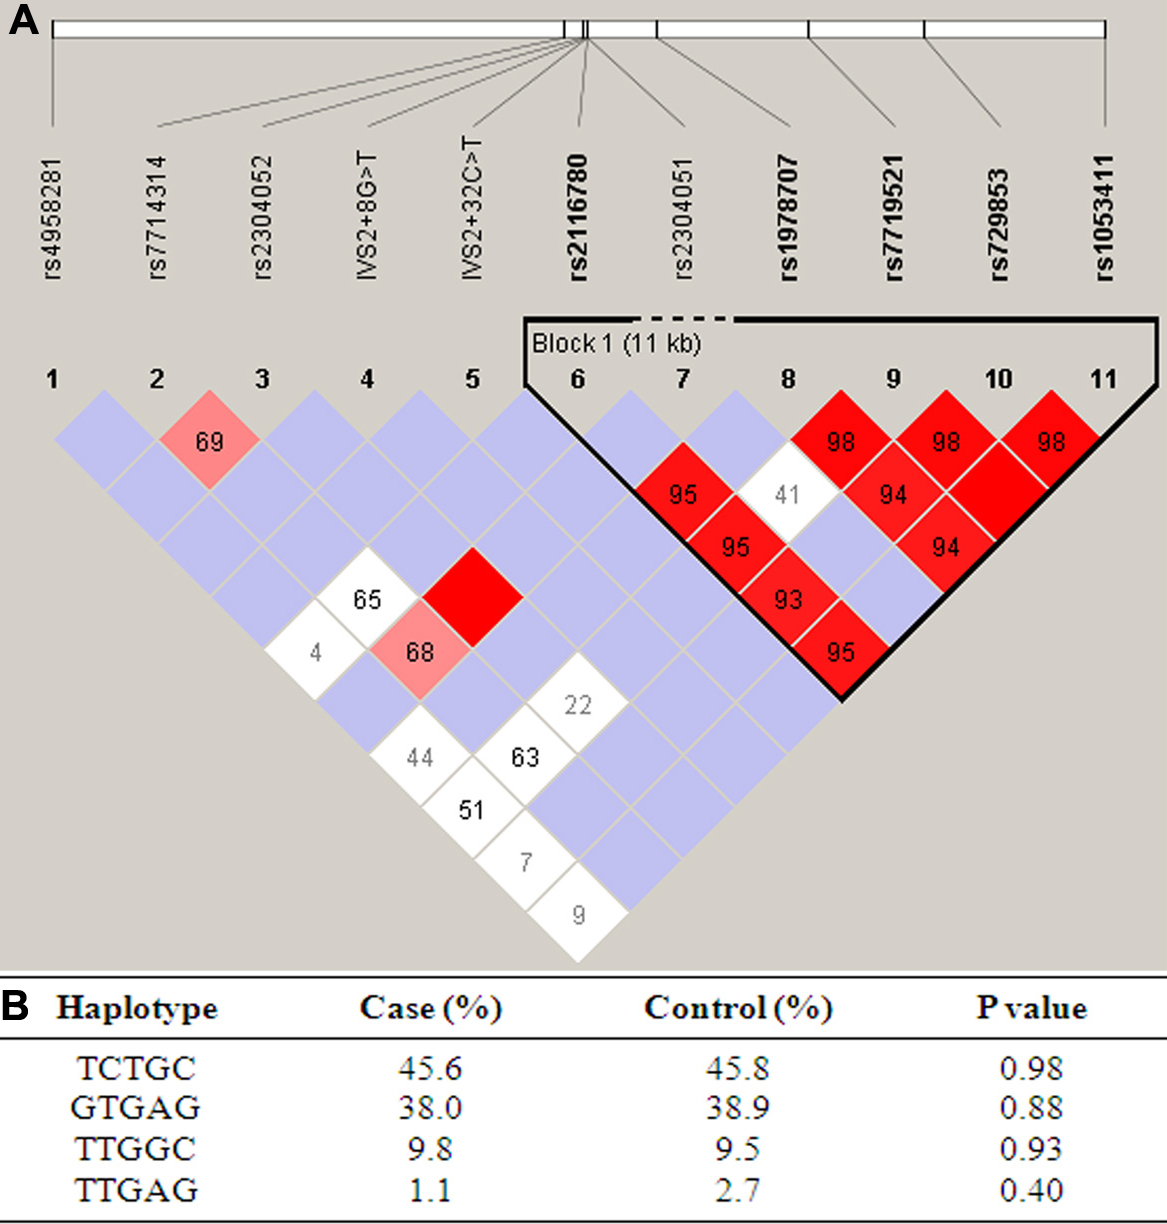
 Figure 2 of
Chen, Mol Vis 2010; 16:2016-2025.
Figure 2 of
Chen, Mol Vis 2010; 16:2016-2025.