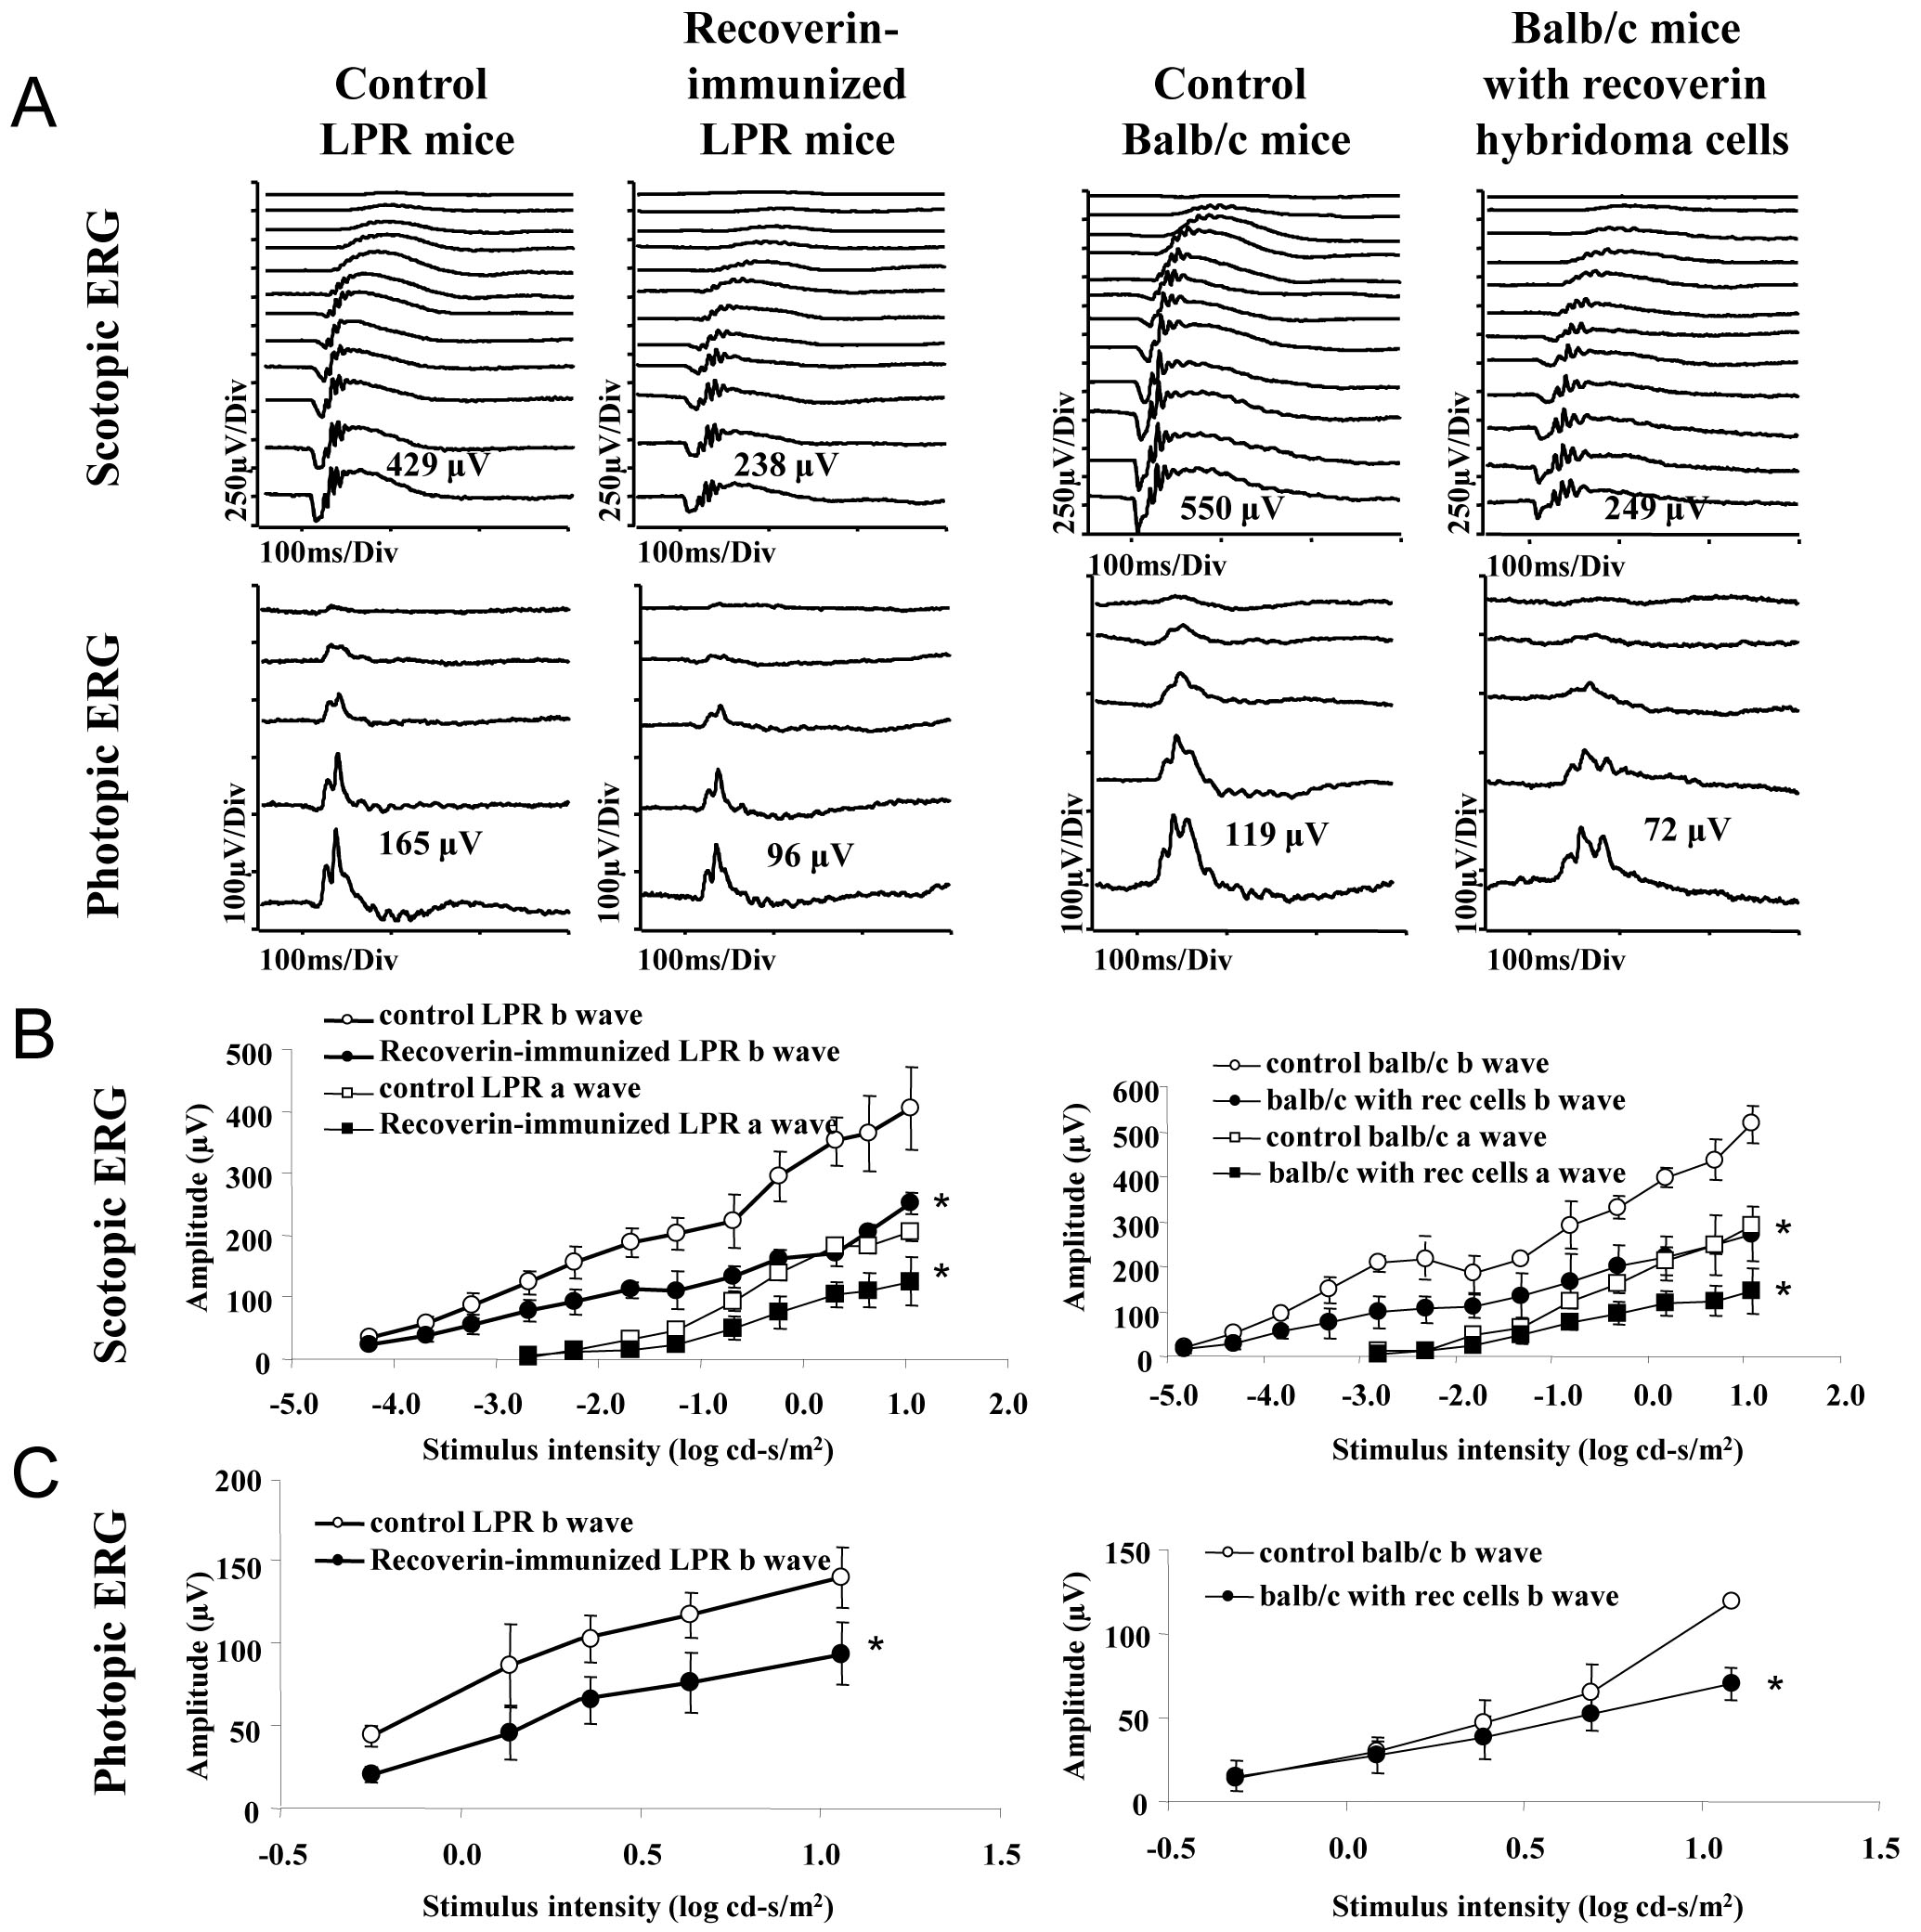
Figure 3. Attenuated electroretinogram
(ERG) response in recoverin-immunized B6.MRL-
Fallpr/J
mice (LPR) mice and balb/cJ mice injected with recoverin hybridoma
cells. Reduced ERG responses from recoverin-immunized
LPR mice
and balb/cJ mice injected with recoverin hybridoma cells was observed
under dark-(scotopic ERG;
A,
B) and light-adapted
(photopic ERG;
A,
C) conditions. Intensity-response
curves of the amplitude of flash b-wave, a-wave from the dark-adapted
ERG was shown in
B, and b-wave amplitudes from the photopic ERG
are depicted in
C. The x-axes indicate stimulus intensity (log
cd-s/m
2). The y-axes indicate amplitude (µV). Student
t-test
showed
multiple
significant
differences between experimental groups
compared to control values (see
Table 1).
 Figure 3 of Lu, Mol Vis 2010; 16:1936-1948.