Figure 3. Analysis of graft-infiltrating T
cells. Activated CD25+ T cells and CD4+ and CD8+
T cell subsets were stained at the time points of corneal allograft
rejection and calculated within the graft. A, C, and E
show representative histological staining for CD25, CD4, and CD8 in
grafts of treated and control animals, respectively. CD25+ (B)
and
CD4+ (D) cells infiltrated to a statistically
significantly stronger extent in 3.2.3-treated animals when compared to
control treated animals (*p<0.01, ** p<0.01). No statistical
difference was observed for CD8+ T cells (NS=not
significant; F).
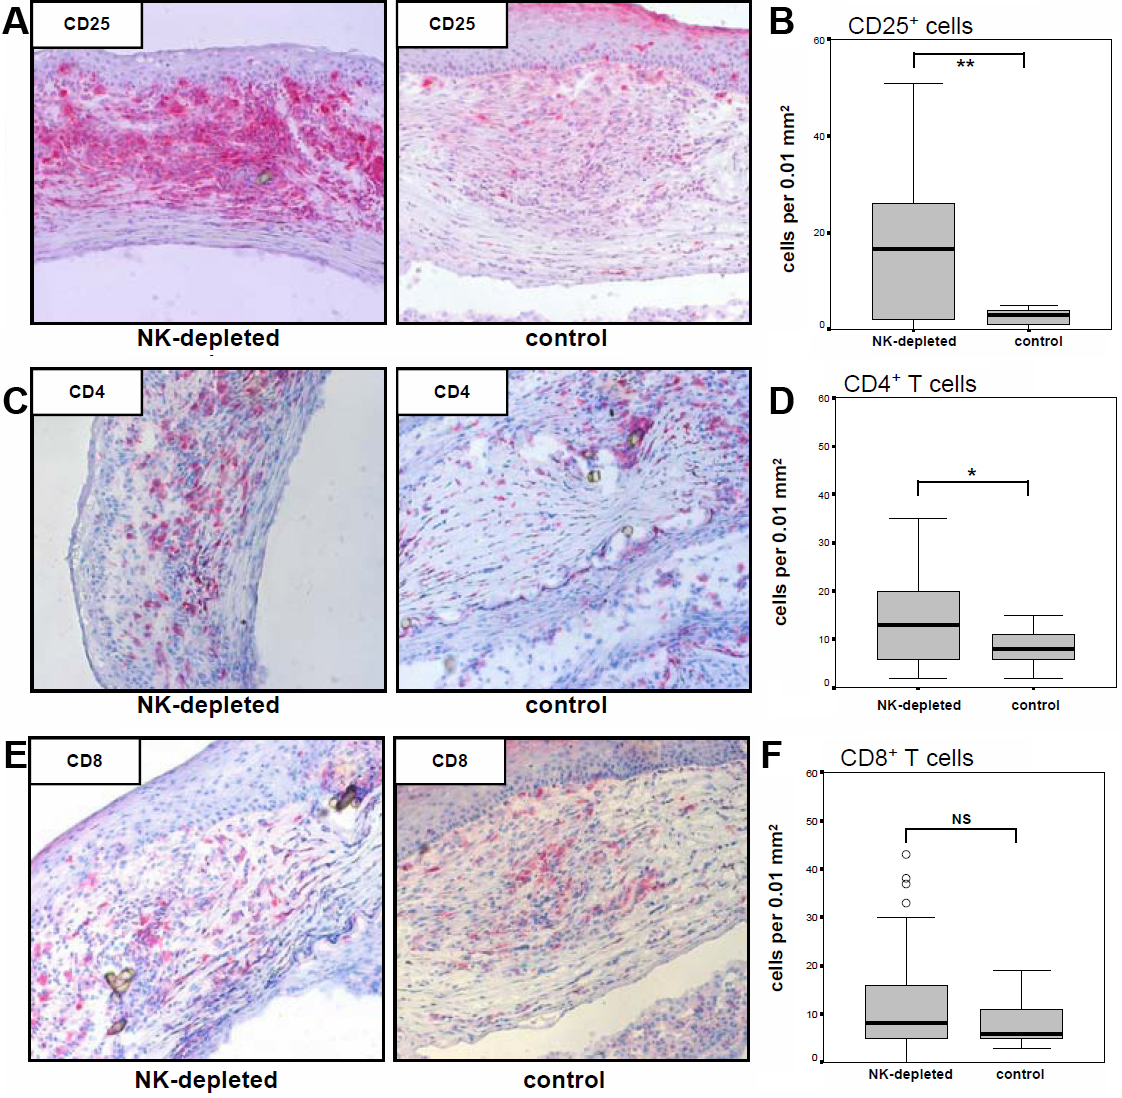
 Figure 3 of Schwartzkopff, Mol Vis 2010; 16:1928-1935.