Figure 1. Pedigree and analysis of a Tunisian family segregating autosomal recessive hearing loss with variability in the diagnosis
of retinitis pigmentosa. A: Pedigree of a Tunisian family and haplotypes of polymorphic markers in the MYO7A region are shown. In pedigree, the square symbol indicates male, the circle symbol denotes female and black symbol represents
affected individuals. B: DNA chromatogram from a control individual (bottom) and patient MB9 (top) are shown. Mutation consists on a homozygous mutation
(G-A) at nucleotide 1935 located in exon 16, resulting in a Met to Ile substitution at amino acid 645 of myosin VIIA. Asterisk
indicates the position of the homozygous mutation. C: Fundus photographs in 40-year-old (P1: MB9) and 47-year-old (P2: MB60) patients showed variability in the severity of retinitis
pigmentosa (RP). MB9 had a mild peripheral RP, while MB60 had only some pigments. D: Visual field test results obtained on the right (RE) and the left (LE) eye of patient MB9 at the age of 40 years are shown.
A series of random lights of different intensities are flashed in the peripheral field of vision of the patient. When the
patient perceives the computer generated light suddenly appearing in his or her field of view, the patient presses a button
to indicate a response. In the picture of the visual field a lighter gray spot is assigned. If the patient is unable to see
the light in an appropriate portion of the field of view, then we see on the computer a darker gray spot (Dot don’t see) indicating
vision loss. Visual field loss was severe in this patient. In fact, the nasal and temporal fields were not preserved and only
the central field was maintained. Ganzfeld electroretinogram (ERG) and visual-evoked potentials (VEP) of RE and LE of patient
MB9 are shown. The ERG and the VEP test the function of the visual pathway from the retina (ERG) to the occipital cortex (VEP).
These tests were conducted by placing a standard ERG device attached to the skin 2 mm above the orbit. VEPs were recorded
simultaneously from an electrode attached to the occipital scalp 2 mm above the region on the midsagittal plane. An electrode
placed on the forehead provided a ground. The results can be directly related to the part of a visual field that might be
defective. This is based on the anatomic relationship of the retinal images and the visual field. After dark adaptation for
30 min, the doctor places anesthetic drops in the patient's eye and places a contact lens on the surface of the eye. Once
the contact lens is in place, a series of blue, red, and white lights is shown to the patient. The VEP is an evoked electrophysiological
potential that can be extracted, using signal averaging, from the electroencephalographic activity recorded at the scalp.
Both the ERG and VEP were differentially amplified band pass filtered (0, 1, 30 Hz), recorded over 300 ms epochs, and signal
averaged. The visual evoked potential to flash stimulation consists of a series of negative and positive waves. The earliest
detectable response has a peak latency of approximately 30 ms post stimulus. For the flash VEP, the most robust components
are the negative peak N2 and positive peak P2 peaks. Measurements of the P2 amplitude should be made from the positive P2
peak at around 207.3 ms. The ERG recorded in MB9 showed an absence of responses. While the VEP showed a normal response in
both eyes. These traces confirm the evidence of a significant bilateral global retinal degeneration. Only cone flicker responses
of less than 15% of the normal mean were recordable under photopic conditions, while all other responses were below noise
level, a typical finding for patients with RP.
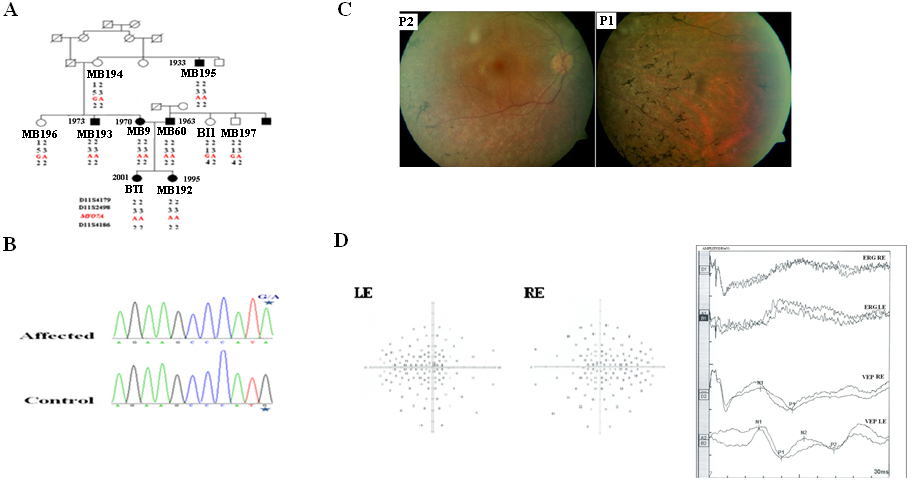
 Figure 1 of
Ben Rebeh, Mol Vis 2010; 16:1898-1906.
Figure 1 of
Ben Rebeh, Mol Vis 2010; 16:1898-1906.