Figure 7. Intraocular pressure (IOP) after glaucoma filtration surgery (GFS). IOP measurements after GFS in a typical case of each treatment
group, i.e., no adjunct control, tablet control, GFS with SB-505124 and MMC control groups, are shown. The lowest IOP was
noticed on post-GFS day 2 or 3 in each case. IOP in the no adjunct control and tablet control groups exceeded 10 mmHg before
week 1 and subsequently plateaued. IOP in the GFS with SB-505124 groups exceeded 10 mmHg before week 2. IOP in the MMC control
is relatively low throughout the observation period. The IOP readings seem to be related to bleb survival in each case. Arrows
indicate the occurrence of bleb failure.
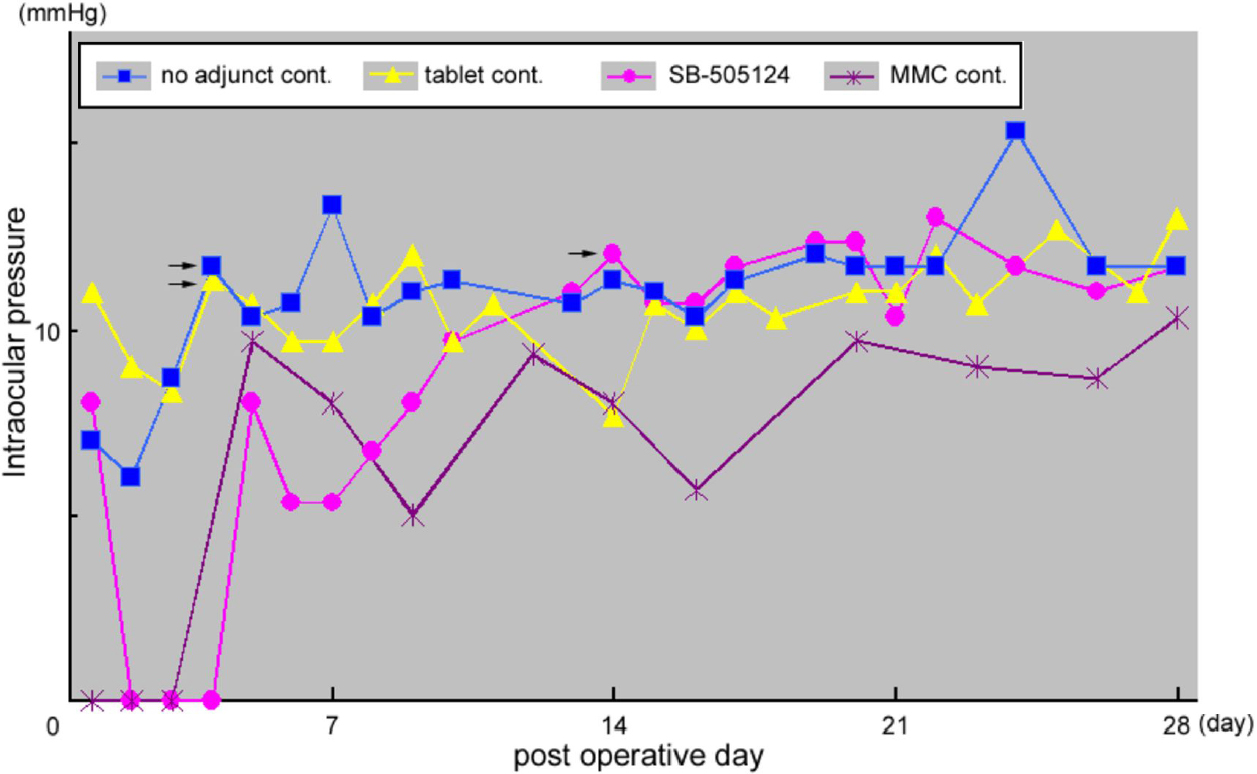
 Figure 7 of
Sapitro, Mol Vis 2010; 16:1880-1892.
Figure 7 of
Sapitro, Mol Vis 2010; 16:1880-1892.