Figure 11. Line graph for cell outgrowth. For each of the GFS with SB-505124 or MMC groups, subconjunctival tissues were dissected from
eyes of two rabbits that underwent GFS five days after surgery. Three pieces of subconjunctival tissue were dissected from
the surgical site and 180° (6-o’clock position) from the surgical site (180° control). The cell outgrowth from each explant
was observed, and the length of the outgrowth from the explant in four quadrants was measured. While a significant difference
was observed in cell growth between the surgical site specimen and the 180° control (p<0.01, 2-way ANOVA) in GFS with MMC,
there was no significant difference in that with SB-505124. Bars indicate standard deviation.
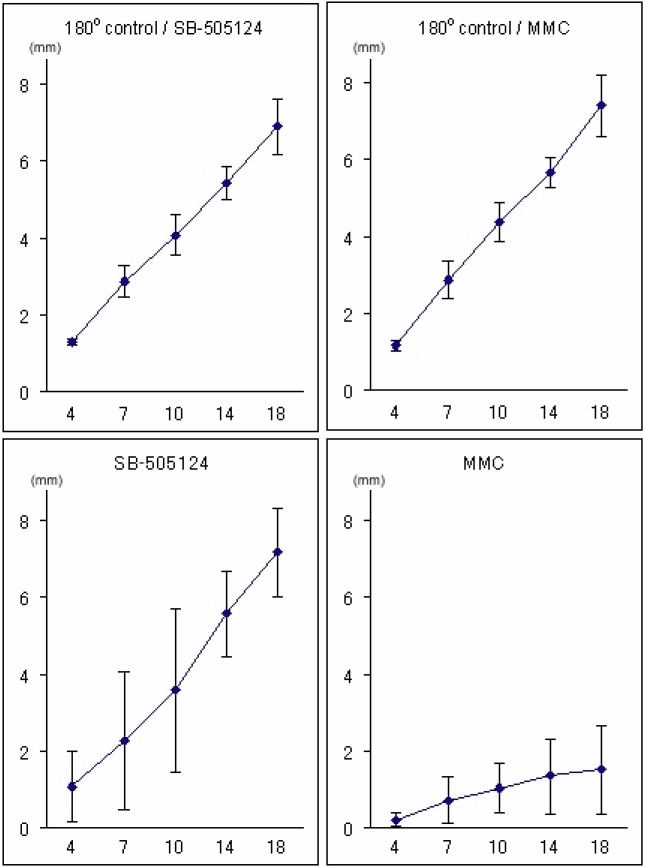
 Figure 11 of
Sapitro, Mol Vis 2010; 16:1880-1892.
Figure 11 of
Sapitro, Mol Vis 2010; 16:1880-1892.