Figure 3. Localization of Caspr in the
outer plexiform layer. A: Immunostaining for Caspr (green)
labeled an intense band in the outer plexiform layer (opl) as well as
AII amacrine cells in the inner nuclear layer (inl) of mouse retina
(Scale bar equal to10 μm). Double labeling with PKC (red) demonstrated
co-localization with Caspr in the opl. Projection of 5 images totaling
a stack thickness of 1.2 µm. B-D: Higher magnification images
of Caspr (B), PKC (C) and overlay (D) of outlined
region in A. Arrows in B, C indicate double
labeled rod bipolar cell dendrites in the opl. Scale bar in D
equal to 10 μm. E-G: High power images of double
labeling for Caspr (E), Syx4 (F) and overlay in opl of
mouse retina. Syx4 labels horizontal cell tips and densely labeled
‘sandwiches’ postsynaptic to cone pedicles (arrows, G). Note
that Caspr labeling is largely not co-localized, and in several cases
falls within a Syx4 sandwich. Large spots of labeling below opl in E
are nonspecifically labeled blood vessels. Scale bar in G equal
to 10 μm. Projection of 5 images totaling a stack thickness of 1.2 µm. H-J:
Double
labeling
of
Caspr (H) with Calbindin (I) and
overlay (J) in tangential section through the opl in mouse
retina. Arrowheads indicate horizontal cell processes double labeled
with Caspr (H) and Calbindin (I). Scale bar in J
equal to 25 μm.
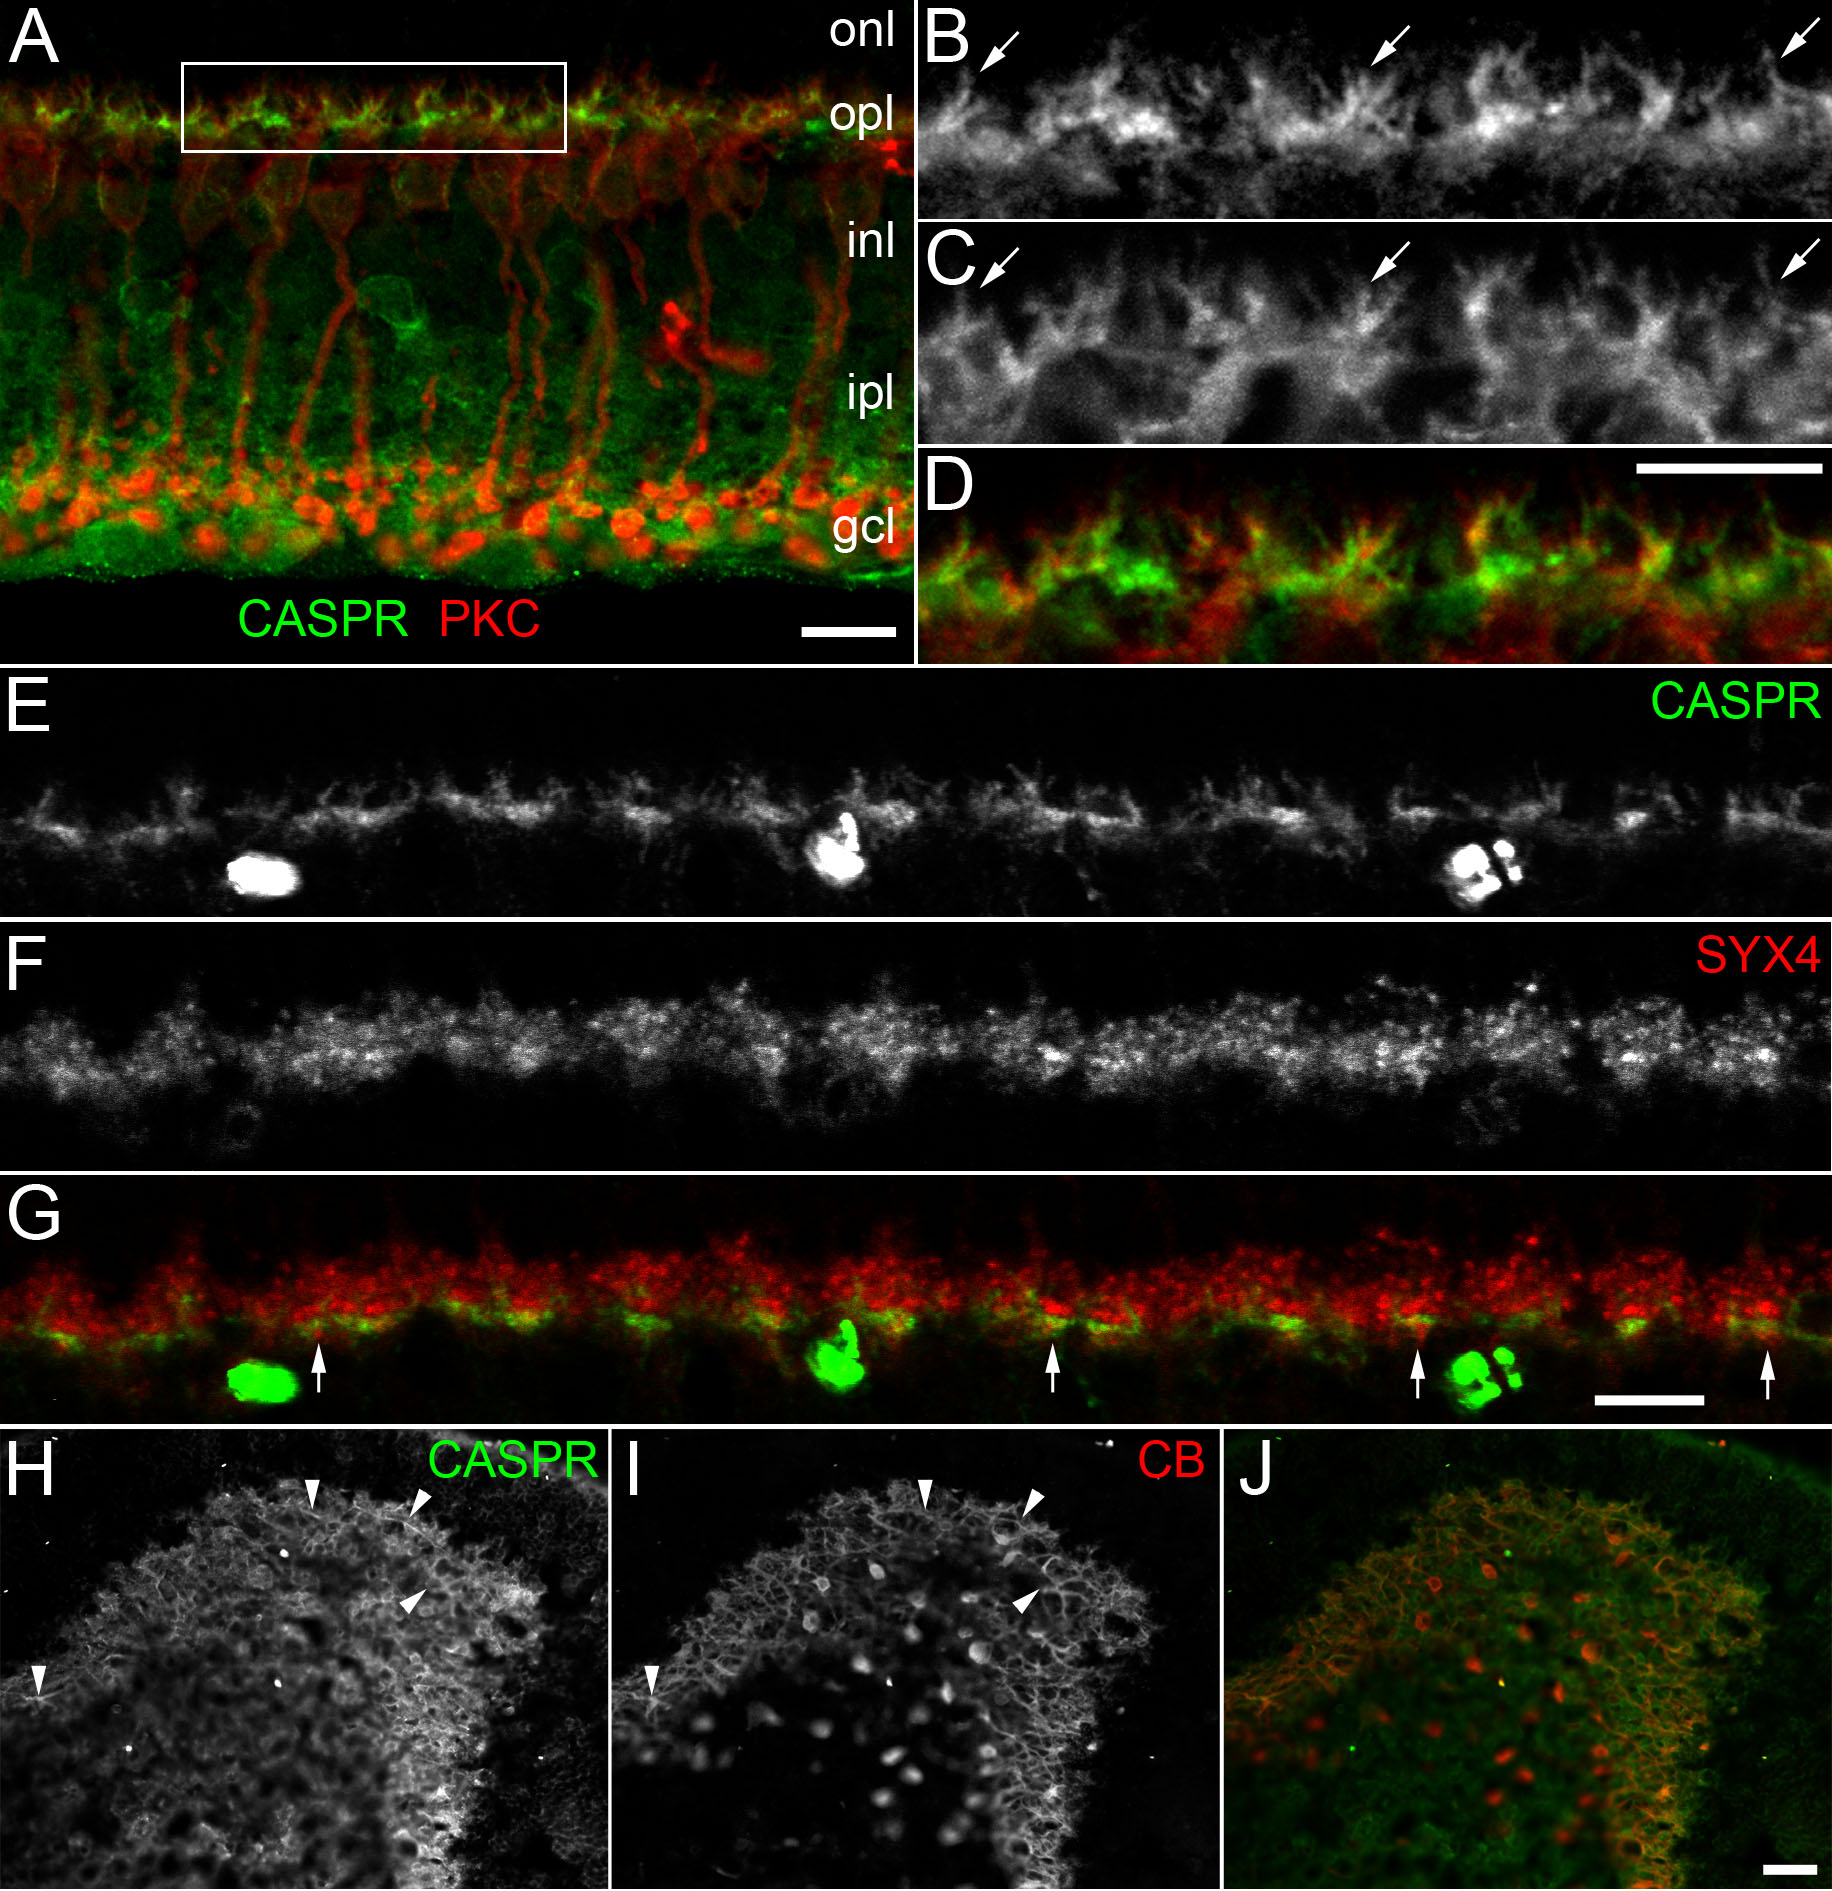
 Figure 3 of O’Brien, Mol Vis 2010; 16:1854-1863.