Figure 3. Differential expression of secernin 1 in the retinal dysplasia and degeneration (rdd) retina. A: Representative 2D montage images generated using Progenesis 2D image analysis software, revealing the modulated expression
of secernin 1 in the wt and rdd chick. Two isoforms of secernin 1 (isoforms “a” and “b”) were identified by MS (arrows). The expression of isoform “a” is
significantly increased from E13 onwards in the rdd retina, while it is only present at very low levels in the wt retina. B: 3D images of the 2D gels generated using Progenesis of the two isoforms of secernin 1 identified by MS. The increased expression
of isoform “a” is evident from E13 onwards in the rdd retina. C: Graphical representation of expression of secernin 1 in the wt and rdd chick displaying the expression of isoform “a” (right panel), isoform “b” (middle panel), and total expression of secernin
1 (left panel). Age is plotted against average normalized volume (n=3±SEM).
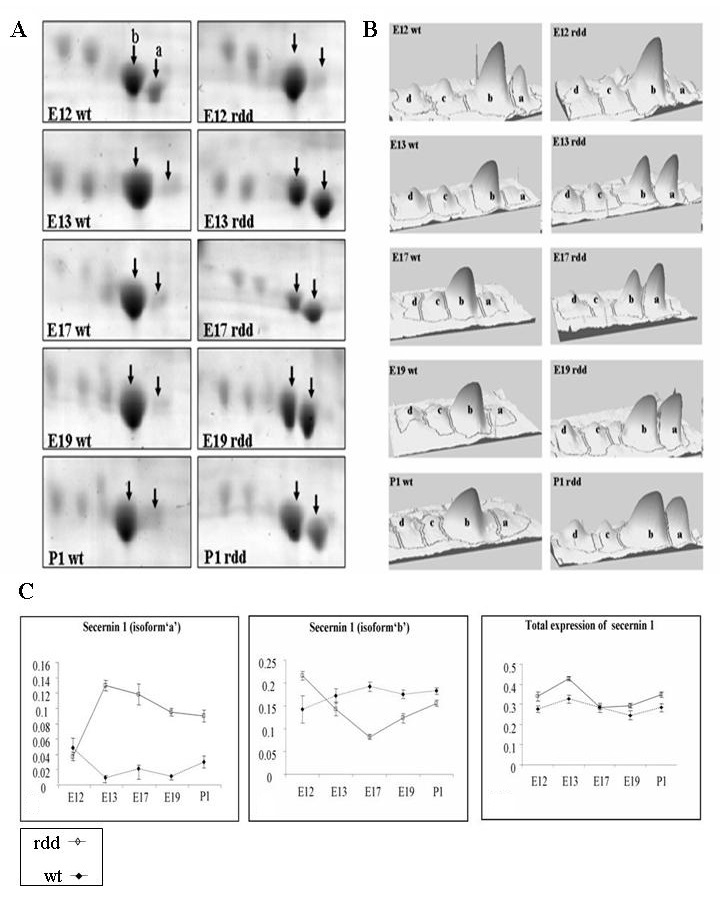
 Figure 3 of
Finnegan, Mol Vis 2010; 16:7-17.
Figure 3 of
Finnegan, Mol Vis 2010; 16:7-17.