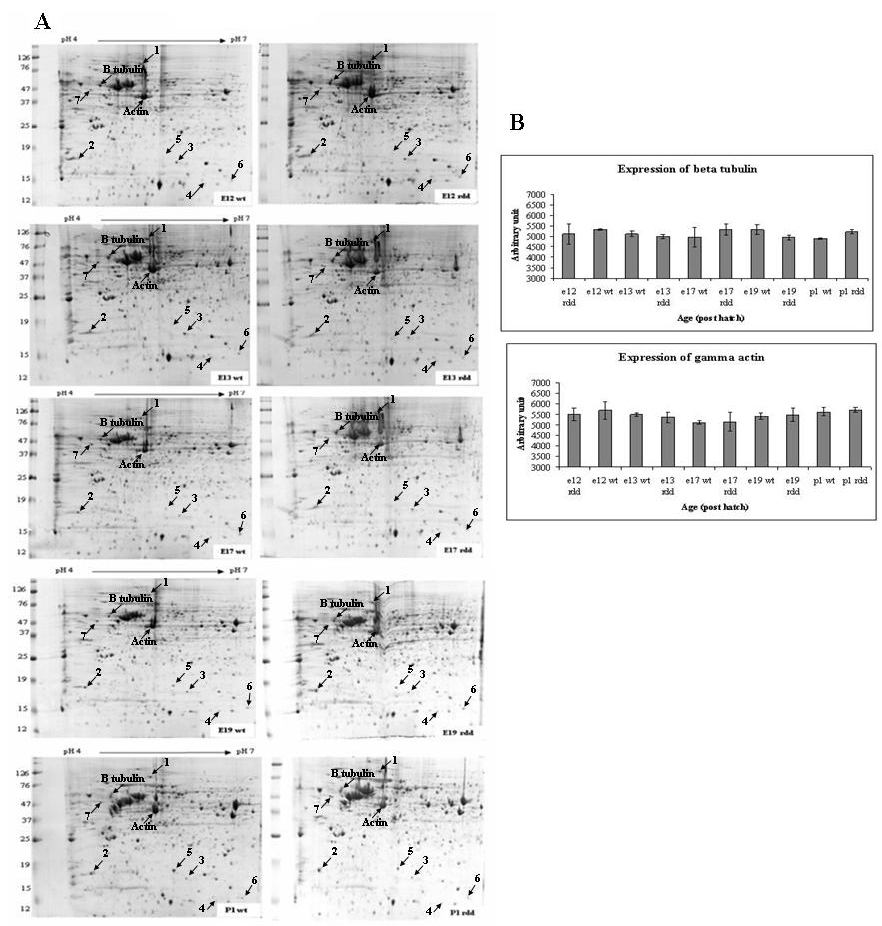
Figure 2. Protein profiles from wild type (wt) and retina dysplasia and degeneration (
rdd) retina.
A-
D: Representative 2D protein profiles from embryonic day (E)12, E13, E17, E19, and post hatch day (P)1
rdd and wt chick retina displaying positions of proteins that were identified by MS (
Table 1). The positions of two housekeeping proteins (β-tubulin and actin) are also shown. Proteins were extracted using 40 mM ammonium
bicarbonate; 1 mg of retinal protein was separated in the first dimension on an 18-cm pH 4–7 IPG strip and in the second dimension
on a 12% polyacrylamide gel. The protein spots were visualized with Coomassie brilliant blue G-colloidal.
B: Levels of actin and tubulin in the
rdd and wt retina. γ-Actin and β-tubulin were identified by MS and used as loading controls for the gels. There was no significant
difference in the levels of actin or tubulin in the wt and
rdd gels from E12 to P1 (
B). Bar charts show age plotted against arbitrary units, with SEM.
 Figure 2 of
Finnegan, Mol Vis 2010; 16:7-17.
Figure 2 of
Finnegan, Mol Vis 2010; 16:7-17.