Figure 9. GJA3 mutation in family SEC18. A: Sequence analysis of GJA3 genomic DNA indicates heterozygosity (red arrow) in the proband. B: Comparison of the wild-type sequence with the proband’s sequence demonstrates a C→T exchange at position 56 leading to an
amino acid alteration at codon 19 (T19M). C: Restriction analysis with (+) or without (-) the enzyme NcoI in members of the family leads to an additional fragment of
688 bp in the mutant DNA (red); it demonstrates the presence of the mutation in the affected father (II.2), in the proband
(III.2) and in his brother (III.1). The asterisks mark the additional band of 688 bp indicating the mutation; the band of
732 bp indicates the undigested DNA. WT represents independent control from the laboratory; M=marker.
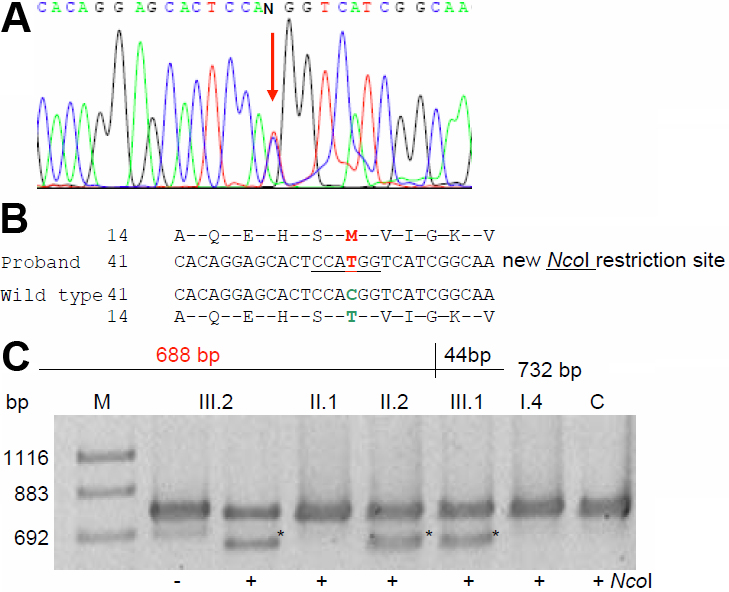
 Figure 9 of
Santhiya, Mol Vis 2010; 16:1837-1847.
Figure 9 of
Santhiya, Mol Vis 2010; 16:1837-1847.