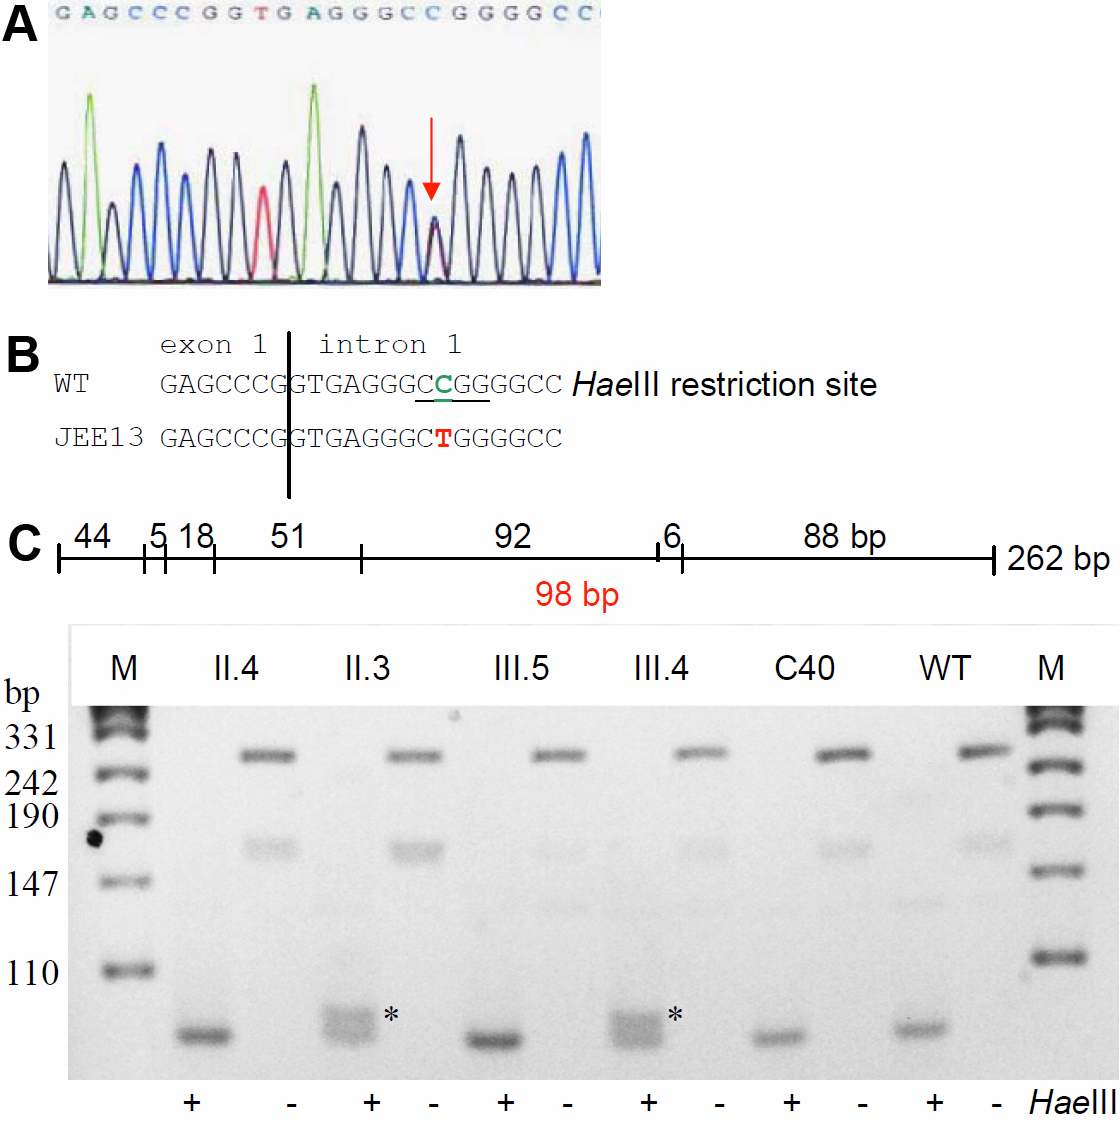
Figure 4. HSF4 mutation in family JEE13.
A: Sequence analysis of
HSF4 genomic DNA indicates heterozygosity at position +9 of the first intron (red arrow) of the proband’s
HSF4 gene.
B: Comparison of the wild-type sequence (
AB029347) with the proband’s sequence demonstrates a C→T exchange at position 9 of intron 1. The mutation leads to a loss of a HaeIII
restriction site (underlined).
C: Restriction analysis with (+) or without (-) the enzyme HaeIII in members of the family leads to an additional fragment
of 98 bp in the mutant DNA (red); it demonstrates the presence of the mutation in the affected mother (II.3) and in the proband
(III.4). The asterisks mark the additional band of 98 bp indicating the mutation; the band of 262 bp indicates the undigested
DNA. C40 and WT represent independent controls from our laboratories; M=marker.
 Figure 4 of
Santhiya, Mol Vis 2010; 16:1837-1847.
Figure 4 of
Santhiya, Mol Vis 2010; 16:1837-1847.