Figure 4. Venn Diagram showing similarity and differences between genes. The diagram is applied to three sets of regulated entities:
those regulated by light damage (LD; compared to control); those regulated by LD when preceded by photobiomodulation (PBM;
compared to control); and those regulated by LD when preceded by saffron feeding (compared to control). These sets were selected
by two-sample Student t test analysis (p<0.05) and fold-change (FC>2).
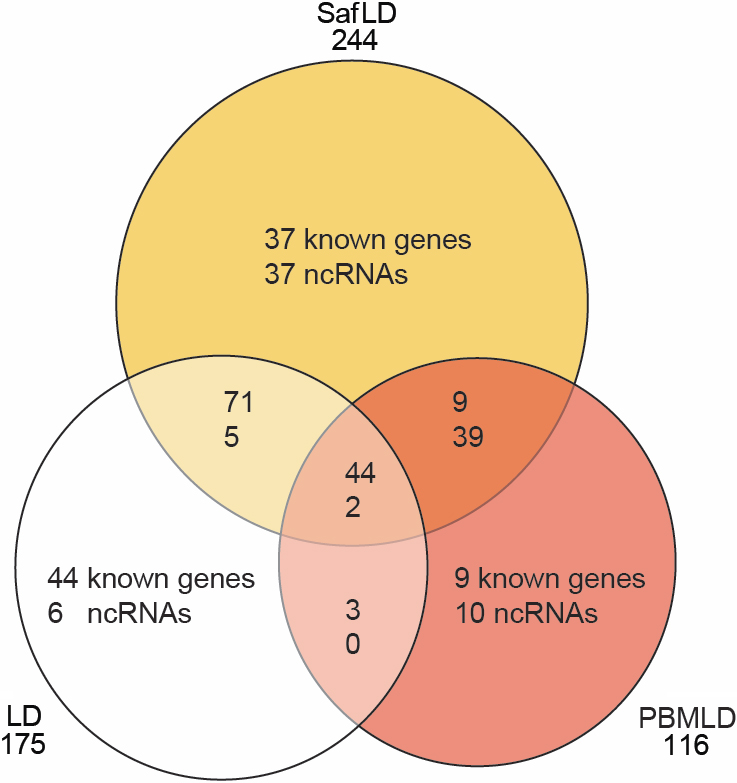
 Figure 4 of
Natoli, Mol Vis 2010; 16:1801-1822.
Figure 4 of
Natoli, Mol Vis 2010; 16:1801-1822.