Figure 3. “Box and whisker” plots of the distributions of entity expression in the six experimental groups (replicates averaged). There
were 187 genes included in these analyses; these were selected by a multi-ANOVA analysis of the six experimental groups (p<0.05,
FC > 2). For each sample, the plot shows the median expression value of these genes as the horizontal line across the box.
The upper and lower ends of the box mark the first and third quartile values, so that the box “contains” half of the sample
value; the extensions show 1.5xIQR, where IQR is the interquartile range for the sample. The red lines indicate “outliers,”
genes or ncRNAs whose expression level was greater or less than 1.5xIQR from the median.
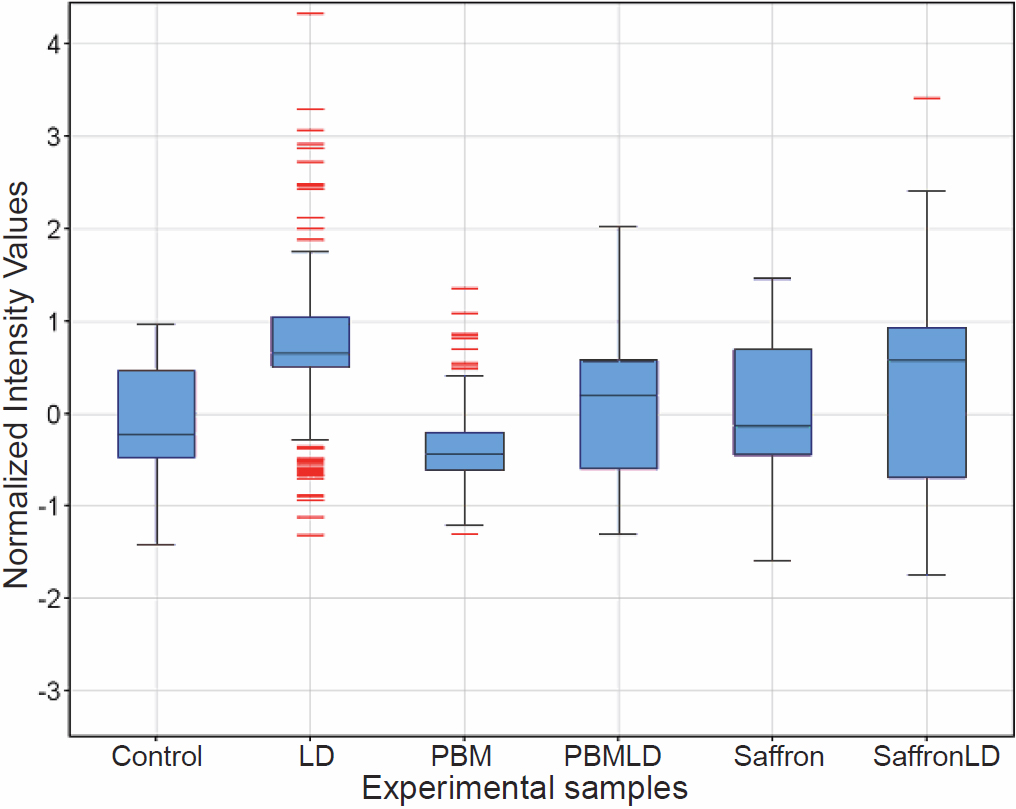
 Figure 3 of
Natoli, Mol Vis 2010; 16:1801-1822.
Figure 3 of
Natoli, Mol Vis 2010; 16:1801-1822.