Figure 2. Hierarchical clustering diagram. This diagram shows the degree of similarity/difference between the 18 samples used in this
study. Each column represents a sample; there were three control samples, three samples from retinas (each retina from a different
animal) treated only with saffron, three from retinas/animals treated only with photobiomodulation (PBM), three from retinas/animals
treated only with light damage (LD), three from retinas/animals treated with PBM and LD, and three from retinas/animals treated
with saffronLD. The columns are arranged so that the most similar ones are next to each other. The branching lines at the
top indicate in more detail the columns/samples that are most similar/different. A: With two exceptions, the three samples from each experimental group resembled each other more than samples in other experimental
groups. The exceptions were PBMLD1, which resembled the PBM samples more closely than the other two PBMLD groups; saffronLD1,
which resembled the PBMLD samples more closely than the other saffron LD groups. Of the three treatments used (PBM, saffron,
LD), LD induced the most variable response by all assessments used. B: When expression values in the three samples of each of the six experimental groups were averaged, a distinct pattern of
similarities emerged. The three saffron-only samples were closer to control than the PBM-only, suggesting that saffron by
itself regulates fewer genes/entities than PBM. The LD-treated groups clustered together, with the two treated groups (PBMLD
and SaffronLD) resembling each other more closely than the LD group. That is, treatment by PBM and Saffron before LD had broadly
similar effects on the LD-induced regulation of genes/entities.
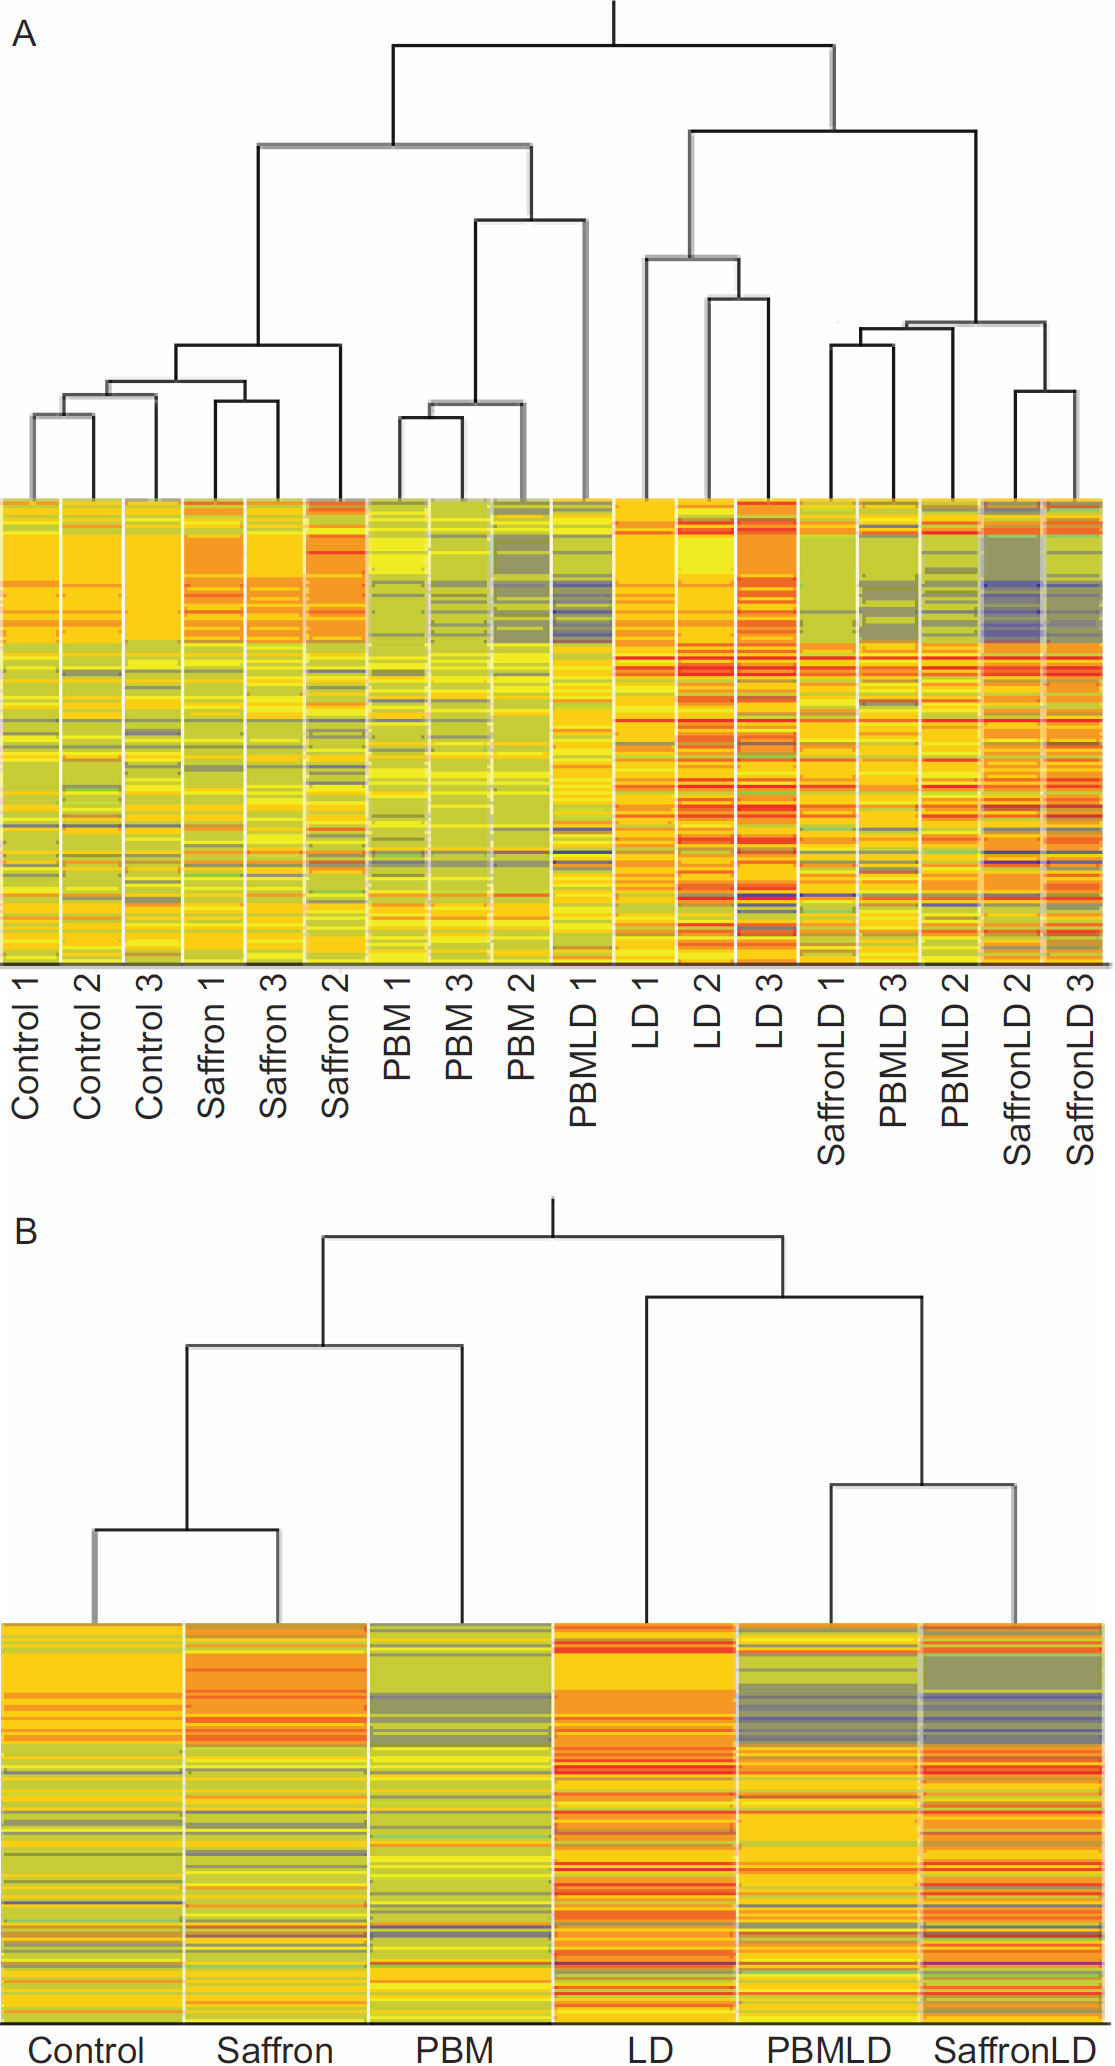
 Figure 2 of
Natoli, Mol Vis 2010; 16:1801-1822.
Figure 2 of
Natoli, Mol Vis 2010; 16:1801-1822.