Figure 3. Effect of RU-486 on mapracorat
or dexamethasone inhibition of hyperosmolarity-induced cytokine release
in T-HCEpiC. Cells were cultured in complete (HCGS containing) medium,
followed by glucocorticoid-free medium for 48 h. Cells were treated
with 440 mOsm hyperosmotic basal media + RU486 and/or mapracorat or
dexamethasone for 24 h. Cytokine release into the media was analyzed by
Luminex. A: IL-6 release; B: MCP-1 release. For both A
and B, the white bar represents 440 mOsm + 100 nM mapracorat
and the black bar represents 440 mOsm + 100 nM dexamethasone; open
circles + dashed line represents 440 mOsm + mapracorat + RU-486; closed
circles + solid line represents 440 mOsm + dexamethasone + RU-486, dark
gray bar represents 440 mOsm alone. Data are presented as mean±SEM,
n=3. *Versus respective 440 mOsm + mapracorat or 440 mOsm +
dexamethasone; for IL-6, dark gray 440 mOsm bar denotes significantly
different from 440 mOsm + dexamethasone and 440 mOsm + mapracorat; for
MCP-1, dark gray 440 mOsm bar denotes significantly different from 440
mOsm + dexamethasone; p<0.05.
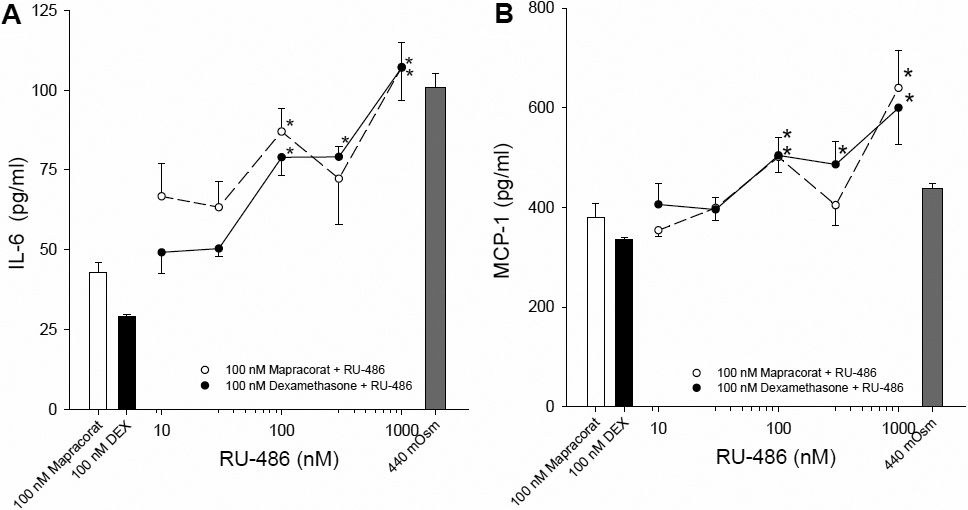
 Figure 3 of Cavet, Mol Vis 2010; 16:1791-1800.