Figure 1. Mapracorat demonstrates similar activity to dexamethasone in inhibiting hyperosmolar-induced cytokine release in T-HCEpiC.
Cells were cultured in complete (HCGS containing) medium, followed by glucocorticoid-free medium for 48 h. Cells were then
treated with 440 mOsm hyperosmotic basal media in the presence of dexamethasone or mapracorat for 24 h. IL-6 (A) and MCP-1 (B) release into the media was analyzed by Luminex. Light gray bar represents control (317 mOsm); dark gray bar represents hyperosmolarity
(440 mOsm); open circles + dashed line represent mapracorat; closed circles + solid line represents dexamethasone. For A, lines are the result of a re-parameterized four-parameter logistic equation fit to the data; for B, lines are the linear interpolation between data points. Data are presented as mean±SEM, n=3. *Versus 440 mOsm hyperosmotic
media; #versus dexamethasone at the identical dose; p<0.05.
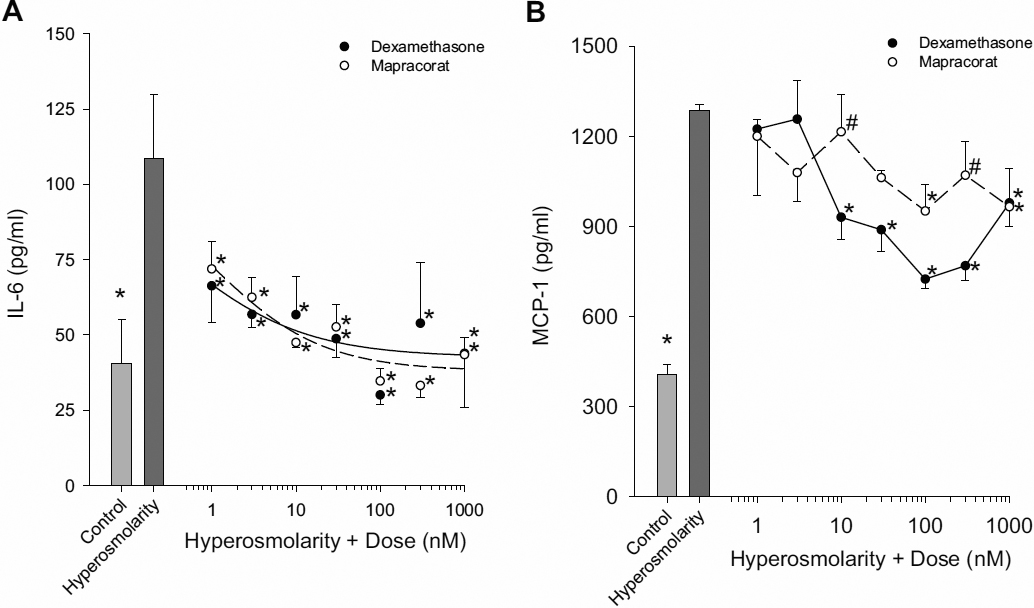
 Figure 1 of
Cavet, Mol Vis 2010; 16:1791-1800.
Figure 1 of
Cavet, Mol Vis 2010; 16:1791-1800.