Figure 4. Effect of forskolin and rolipram
co-treatment on TER dynamics. The changes in TER were measured in
response to TNF-α (T) with or without co-treatment with 10 µM forskolin
(F) and 50 µM rolipram (R). A: Typical responses. B:
Summary of six independent experiments. The % reduction in TER induced
by the cytokine is significant when compared to control at >8 h.
Co-treatment with F and R opposes the (TNF-α)-induced reduction in TER
after 12 h of exposure. * and ** denotes p<0.001 when comparing the
TNF-α-treated group with the control group and the (TNF-α+F+R)-treated
group with the TNF-α-treated group, respectively.
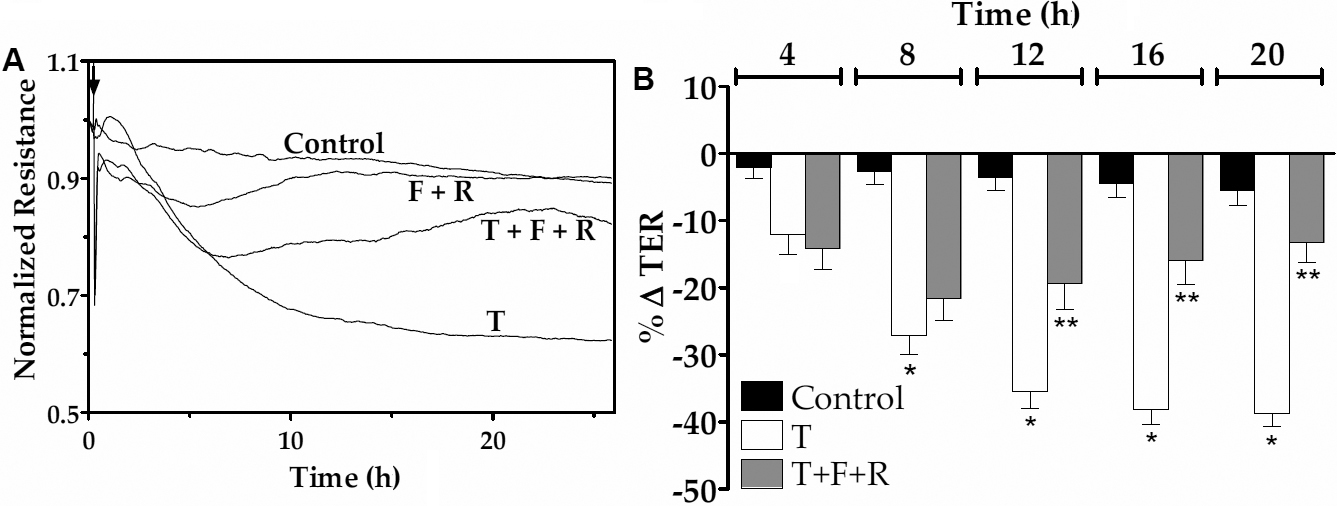
 Figure 4 of Shivanna, Mol Vis 2010; 16:1781-1790.