Figure 2. Effect of elevated cAMP on the
distribution of ZO-1 and cadherins. Cells were treated with TNF-α (T)
for 6 h and where indicated were co-treated with 10 µM forskolin (F)
and 50 µM rolipram (R). A-D: Distribution of ZO-1. In
untreated cells (Control, A), the ZO-1 is contiguous at the
cell-cell border (shown by arrows). It is undisturbed by F and R (B).
Exposure
to TNF-α (C) induced dispersion of ZO-1 (shown by
arrows), which was opposed by co-treatment with F and R (D). E-H:
Pan-cadherins
at the focal plane of AJC. In untreated cells (Control, E),
localization of cadherins at the region of cell-cell contacts is
intense (shown by arrows). Upon treatment with F and R (F), the
distribution of cadherins is unaltered. Exposure to TNF-α (G)
resulted in reduced intensity of cadherins at the cell border as well
as sporadic disengagement (shown by arrows). Co-treatment with F and R (H)
prevented
the TNF-α response. All the images shown are representative
of at least three independent experiments.
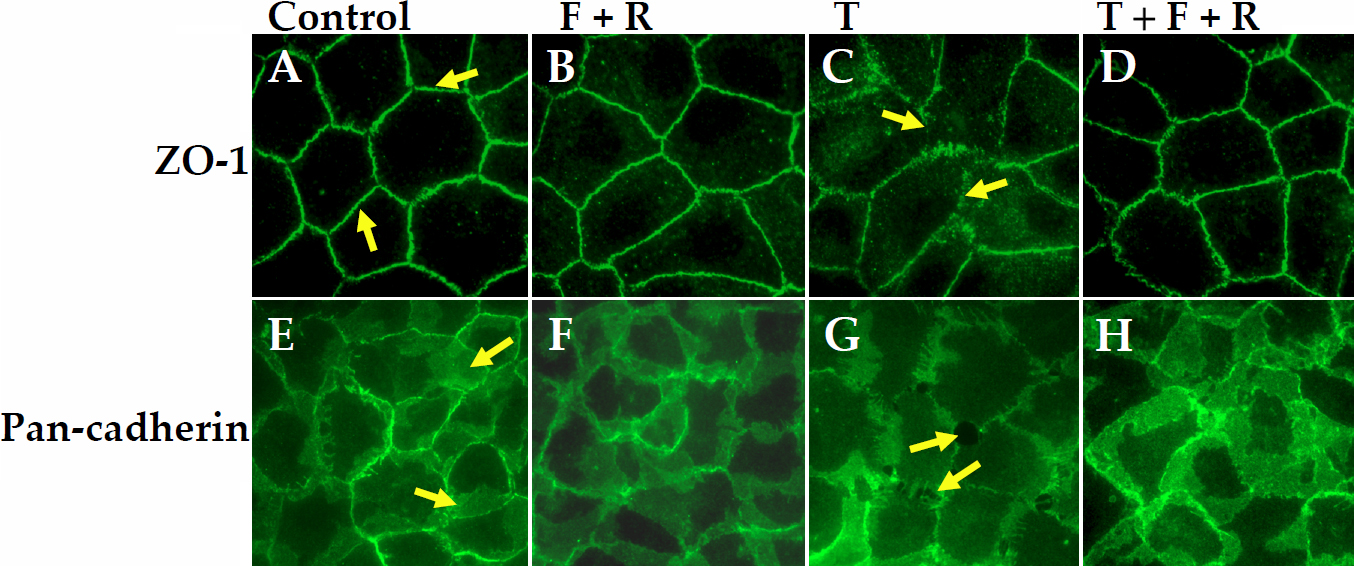
 Figure 2 of Shivanna, Mol Vis 2010; 16:1781-1790.