Figure 4. Membrane bound MUC1 expression as quantified by western blotting. Protein samples collected via impression cytology. MUC1
data expressed in Units/μg protein as calculated from interpolation from a standard curve made from titration of CA15–3. The
asterisk indicates significantly different compared to the NDE Group.
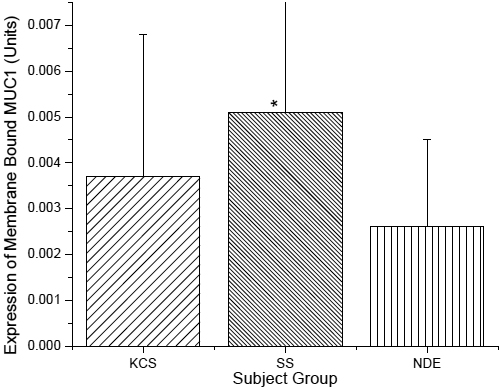
 Figure 4 of
Caffery, Mol Vis 2010; 16:1720-1727.
Figure 4 of
Caffery, Mol Vis 2010; 16:1720-1727.