Figure 2. Soluble MUC1 expression as quantified by western blotting. Data expressed as (A) scatter graph of individual data points and (B) mean data. Protein samples collected via eye wash and MUC1 data expressed in Units/μg protein as calculated from interpolation
from a standard curve titration of CA15–3. The asterisk indicates significantly different compared to NDE Group. The sharp
(hash mark) indicates significantly different compared to KCS Group.
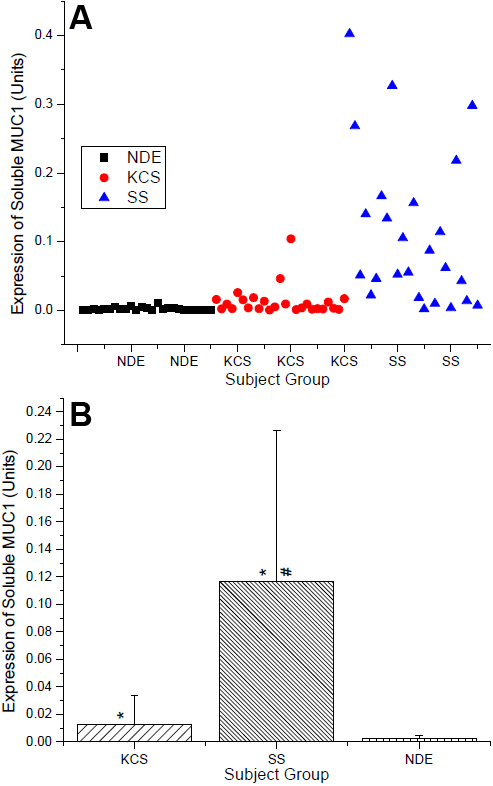
 Figure 2 of
Caffery, Mol Vis 2010; 16:1720-1727.
Figure 2 of
Caffery, Mol Vis 2010; 16:1720-1727.