Figure 1. Western blot and regression analysis for soluble MUC1 quantification A: Examples of Soluble MUC1 western blots from tear samples derived from Normal, KCS, and SS and subjects. Lanes 1–6 are MUC1
standard antigen (CA15–3) Units; (Lane 1=0.3, Lane 2=0.1, Lane 3=0.06, Lane 4=0.03, Lane 5=0.01, Lane 6=0.003 U); Lanes 7–13
are examples of tear samples from Normal, Lanes 14–20 are from KCS, and Lanes 21–26 are from SS. B: A regression curve was created by graphing applied concentration of CA15–3 standard against the optical density of the resulting
band immunoreactivity. Total MUC1 concentration was quantified by interpolation from this curve. MW standard (460) is listed
on the left.
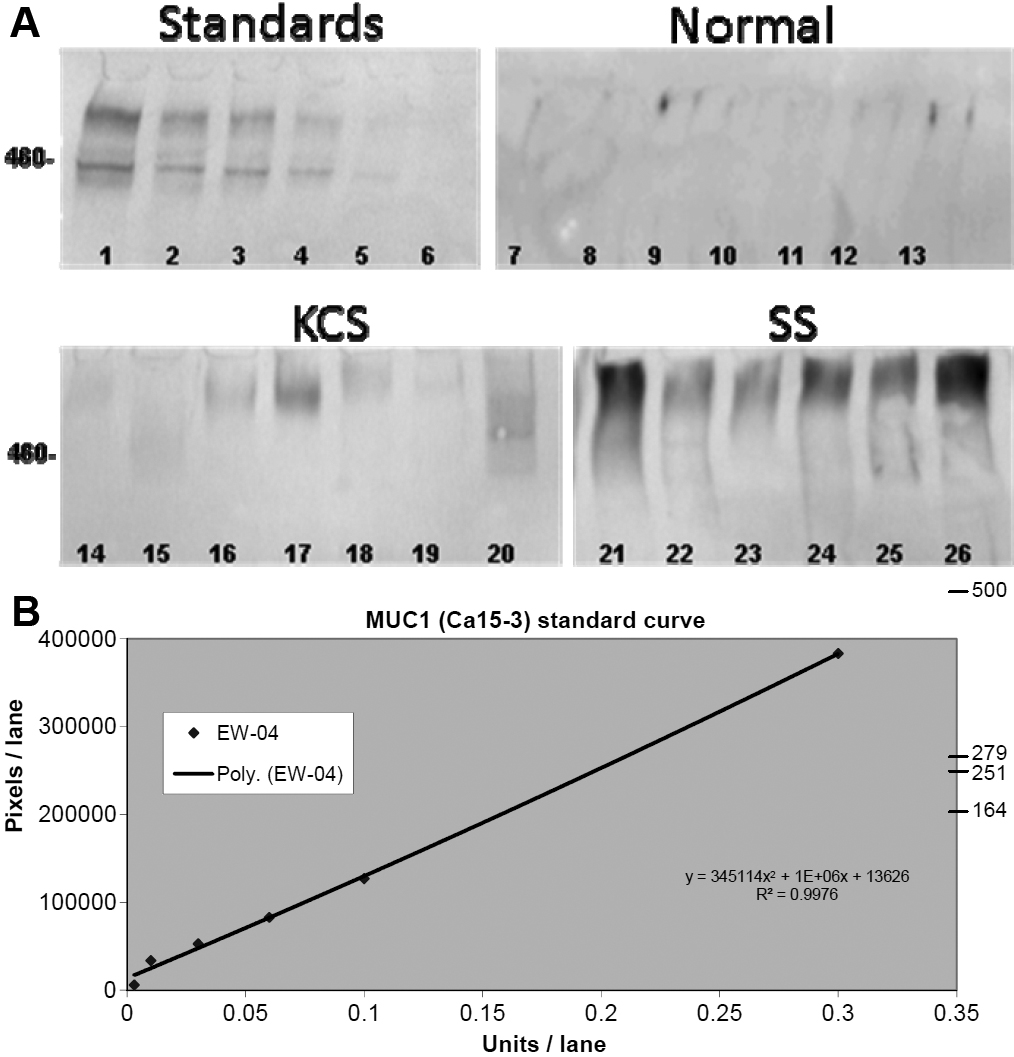
 Figure 1 of
Caffery, Mol Vis 2010; 16:1720-1727.
Figure 1 of
Caffery, Mol Vis 2010; 16:1720-1727.