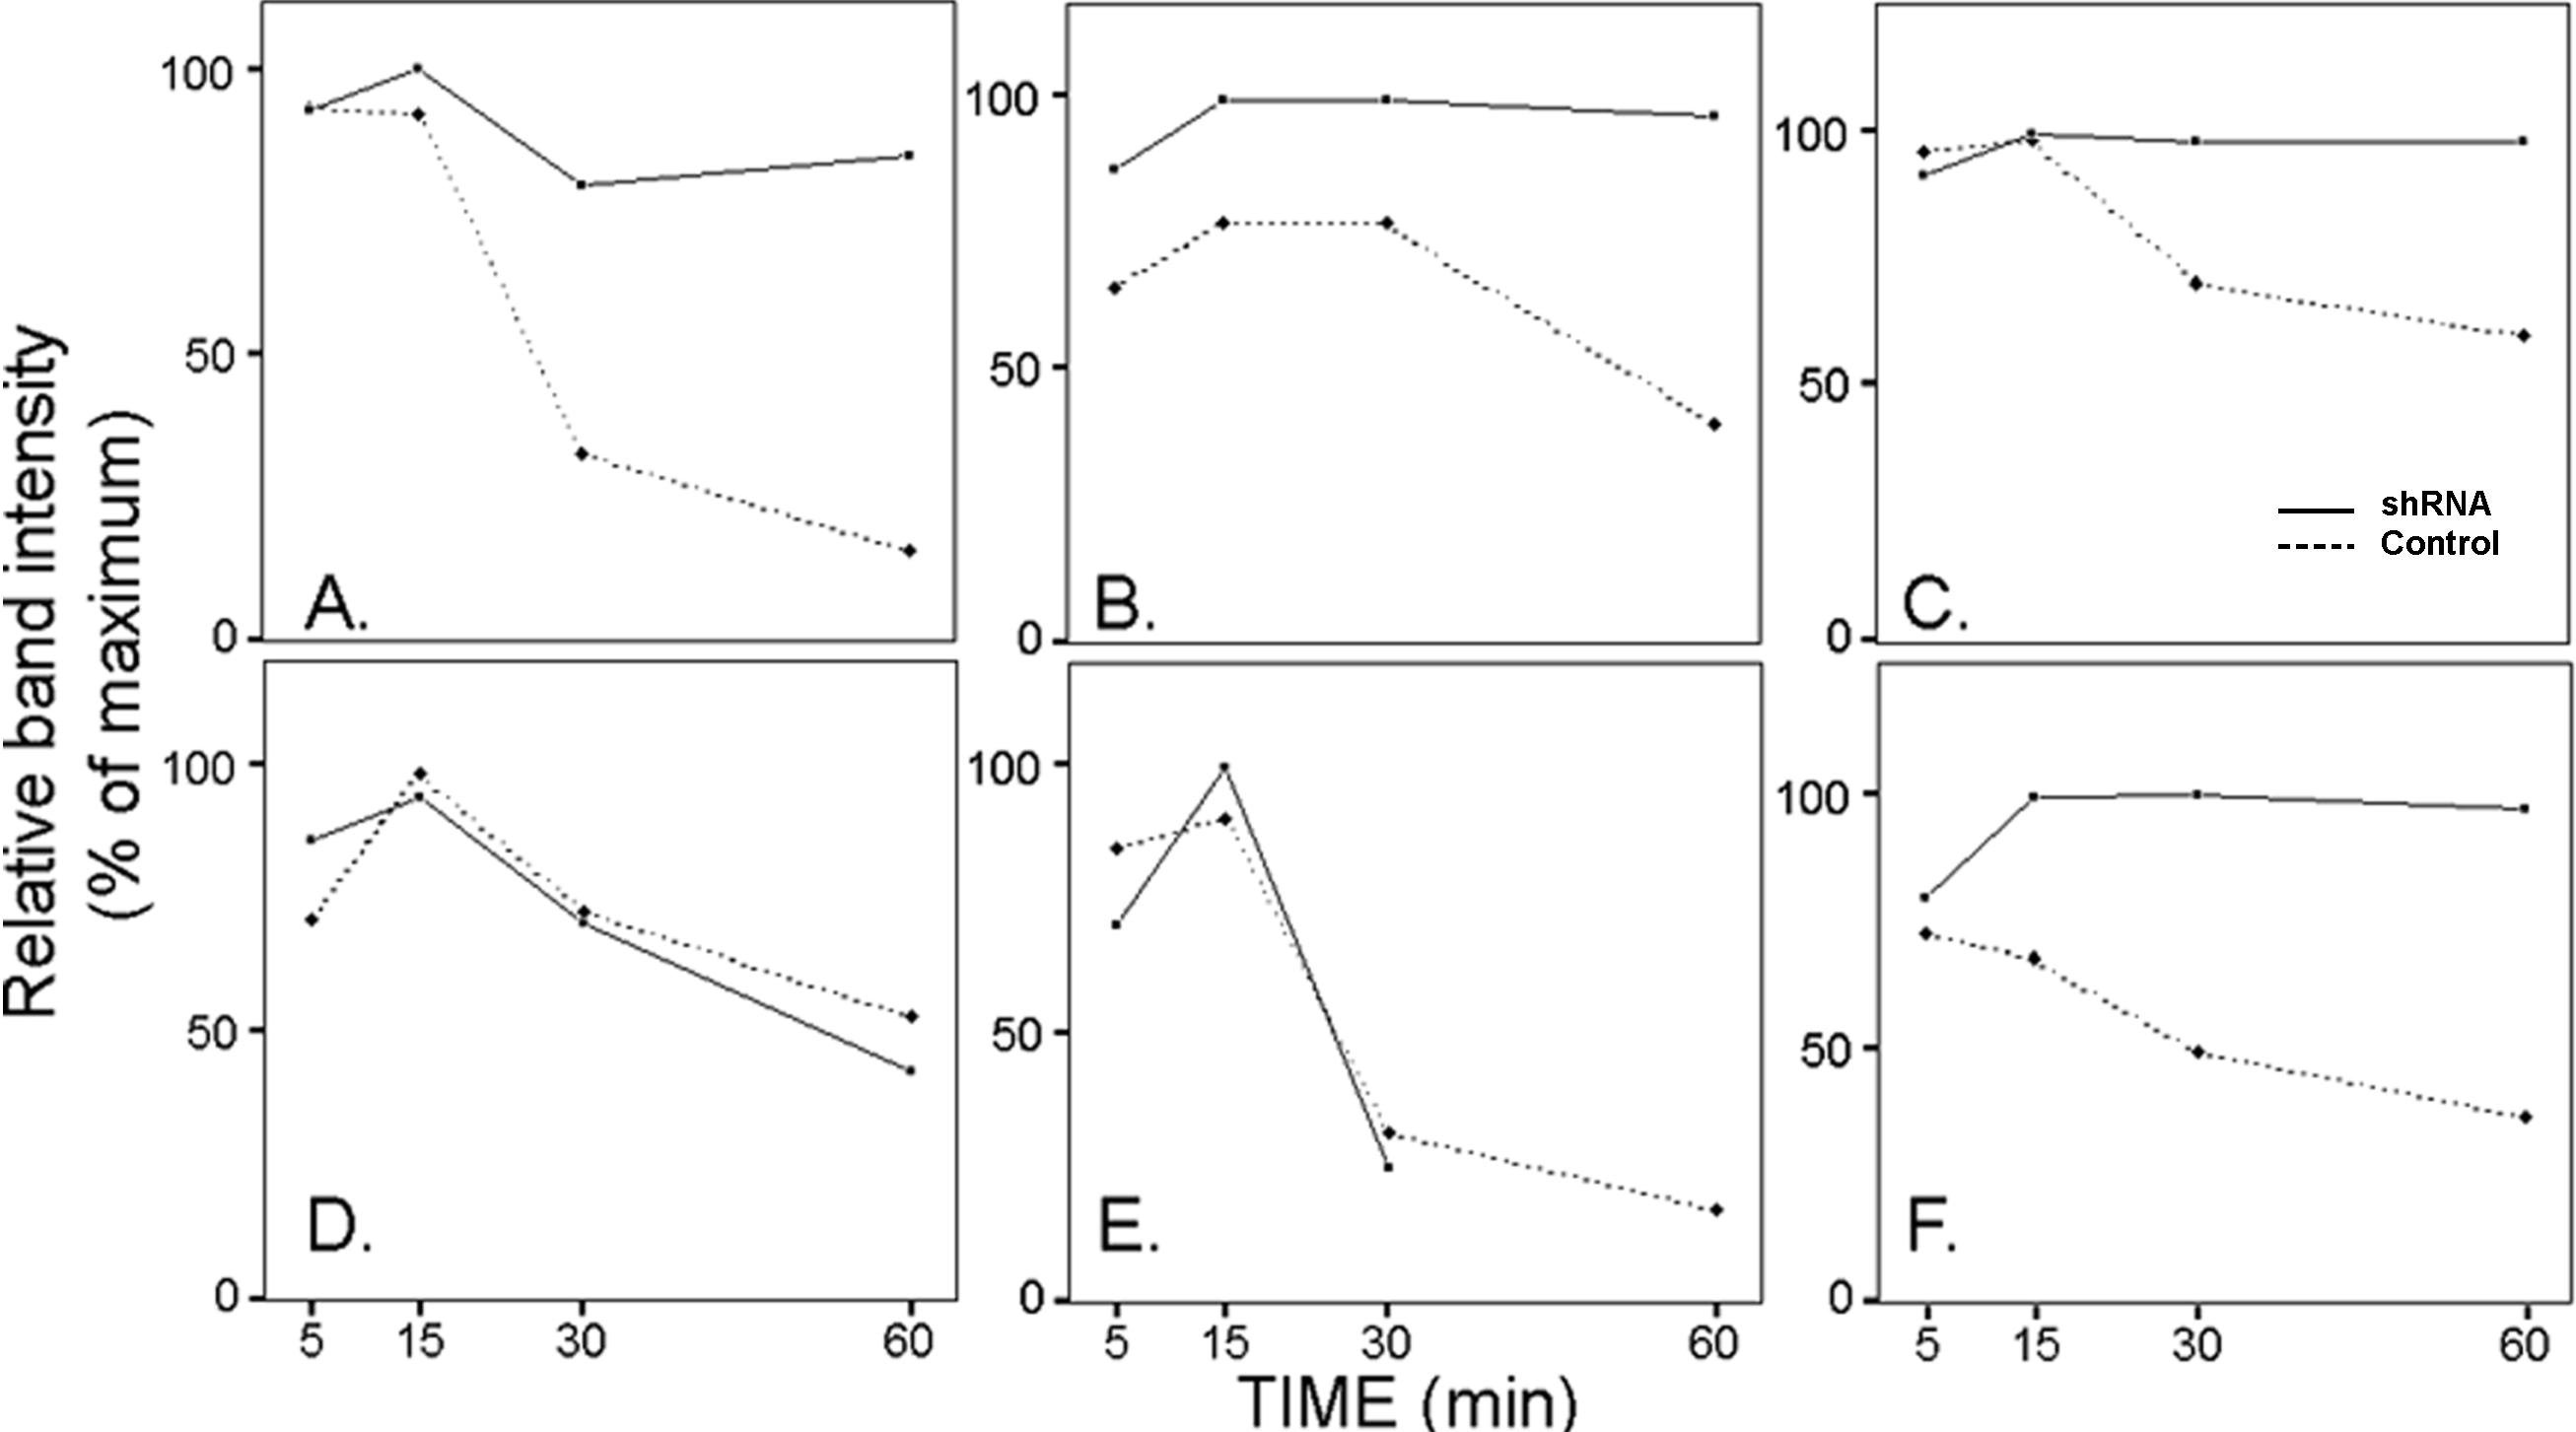
Figure 3. Densitometric plots of the
phosphorylated MAPK bands displayed in
Figure 2.
A and
D:
p.p38.
B and
E: pJNK1.
C and
E: pErk1.
Top frames are for
DUSP1 shRNA, bottom frames for
DUSP5
shRNA. The values were normalized respective to loading controls,
either total Erk or actin.
 Figure 3 of Wang, Mol Vis 2010; 16:1696-1704.