Figure 1. Basic features of svHCECs transduced with various lentivectors. A-H: Light scatter plots (A, C, E, and G) and histograms of GFP fluorescence (B, D, F, and H). A,B: control cells; C,D: DUSP1 shRNA cells; E,F: DUSP5 shRNA; G,H: DUSP6 ORF. I,J: Control cells (I) and cells transduced with the MYC tagged DUSP6 ORF (J). In the control stain is seen exclusively in the nucleus, corresponding to the location of myc expression. In the transduced
cells there is additional stain throughout the cytosol including strong stain in the perinuclear area. K: western blot of all three terminal MAPKs and actin for the control cells and cells transduced with DUSP1, DUSP5, and non coding (NC) shRNA and the MYC tagged DUSP6 ORF.
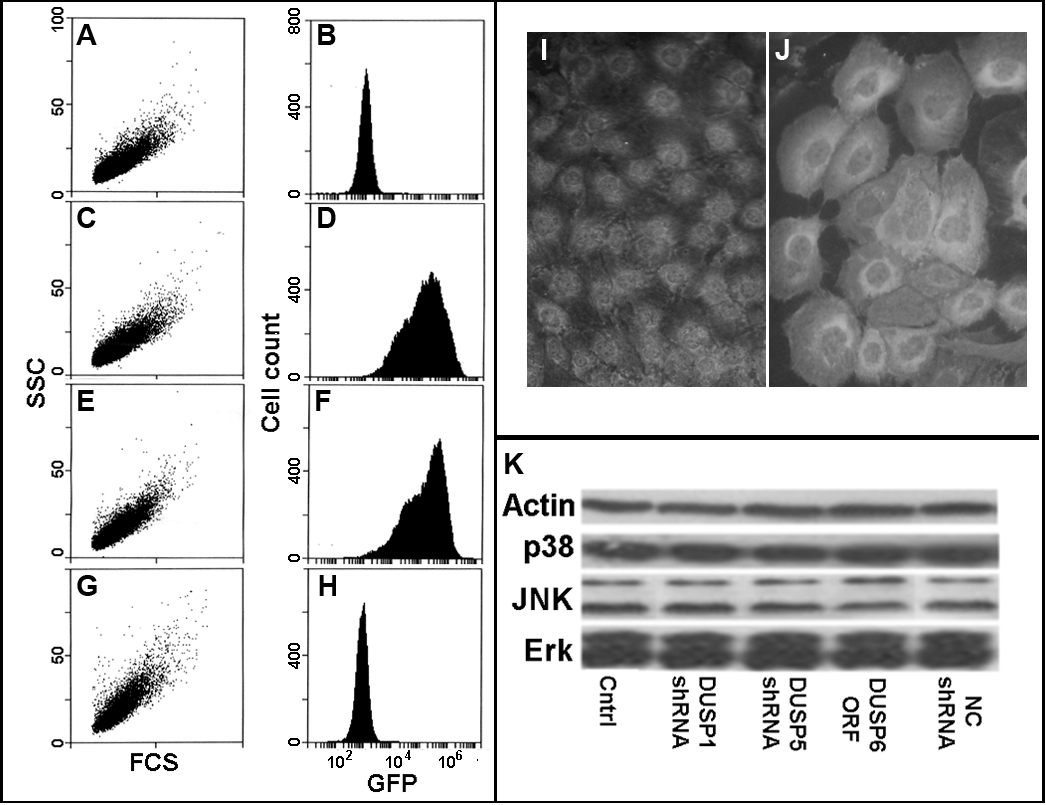
 Figure 1 of
Wang, Mol Vis 2010; 16:1696-1704.
Figure 1 of
Wang, Mol Vis 2010; 16:1696-1704.