Figure 7. The expression of interferon-γ in the aqueous humor and serum at different time points (expressed as the mean μg/l±SD). Interferon-γ
concentrations in the aqueous humor and serum were not significantly different at 8 h or 16 h in comparison to the control
group.
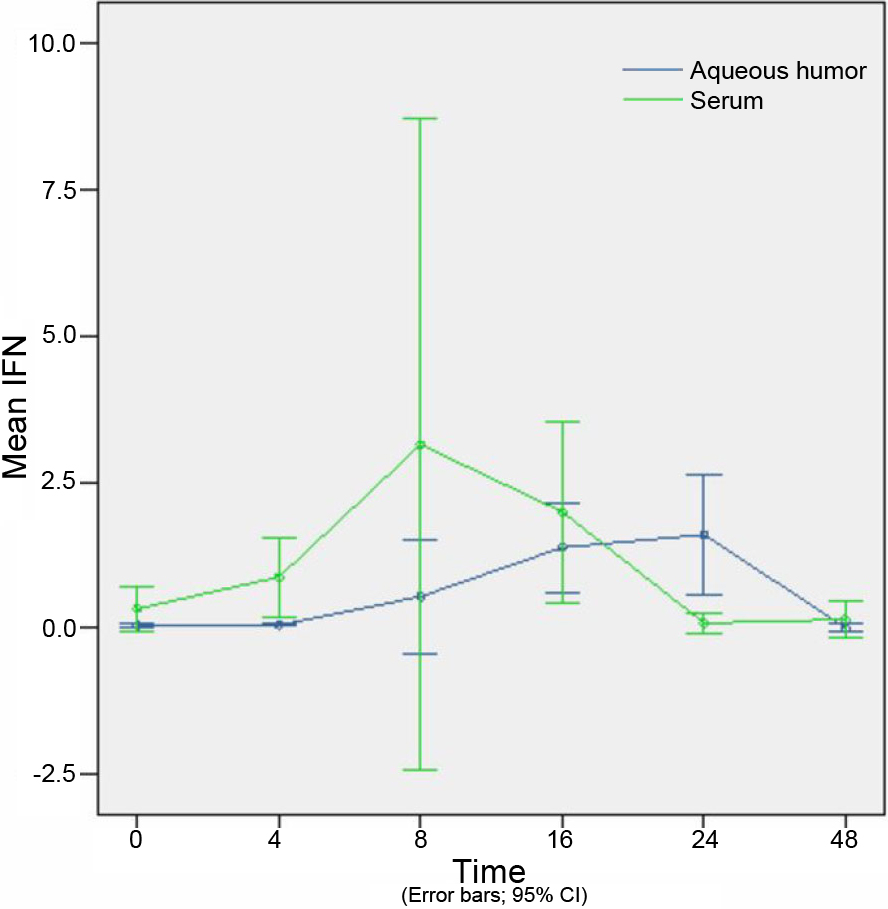
 Figure 7 of
Xu, Mol Vis 2010; 16:1689-1695.
Figure 7 of
Xu, Mol Vis 2010; 16:1689-1695.