Figure 3. Evaluation of HSPs pre and post air lifting in AM and PD groups. A: Representative fluorescent staining indicates HSC70, HSP72, and HSP90 are expressed in cytoplasm. HSP72 also detected in
few nuclei of cells cultured on amniotic membrane before and after air lifting. The nuclei were stained by DAPI (Blue). Scale
bar: 100 µm. B: Representative histograms show the percentage of cells positive for HSC70, HSP72, and HSP90 on plastic dish. Black line
indicates isotype control and red points out HSPs. C: Comparative data for PD and AM groups for HSPs before and after air lifting. D: RT–PCR shows the gene expression of HSC70, HSP72, and HSP90 before and after air lifting in AM and PD. GAPDH was used as
internal control. Results were presented as percentage of 3 to 4 different experiments and expressed as mean±SD. The asterisk
indicates a p<0.05 and the double asterisk indicates a p<0.01.
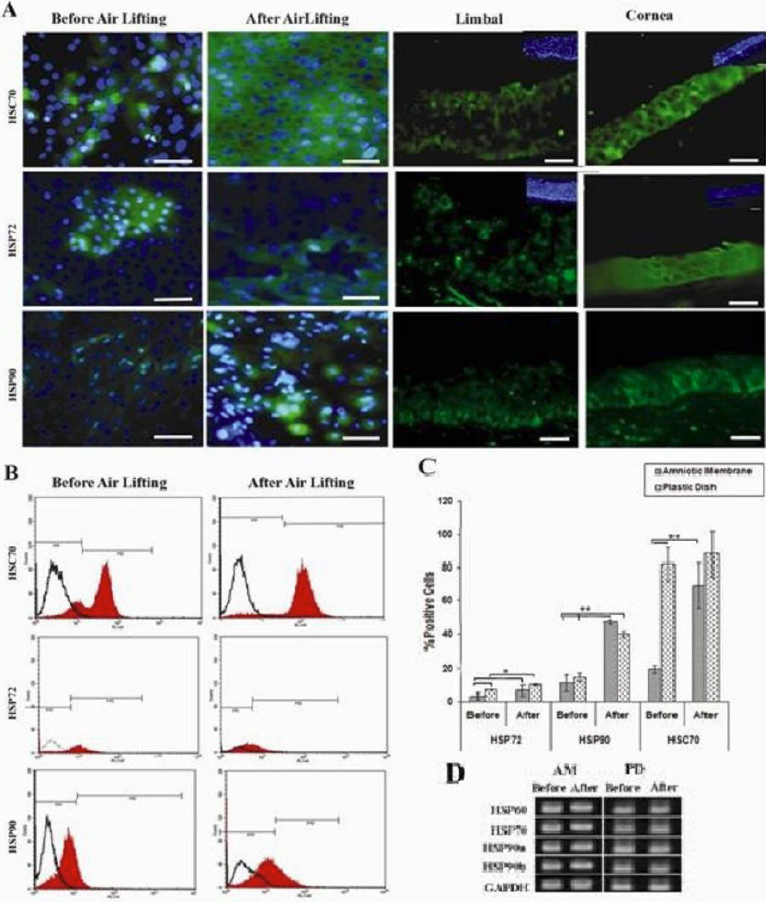
 Figure 3 of
Ebrahimi, Mol Vis 2010; 16:1680-1688.
Figure 3 of
Ebrahimi, Mol Vis 2010; 16:1680-1688.