Figure 6. Evaluation of retinal function by electroretinography. Evaluation of retinal function by electroretinography was determined
by taking measurements of a- and b-wave amplitudes in Fat1+/VPP+, Fat1–/VPP+, Fat1+/VPP–, and Fat1–/VPP– mice (n=10). A, C, E: The average a-wave amplitudes are shown at 4, 16, and 28 weeks of age, respectively. B, D, F: The corresponding b-wave amplitudes are shown.
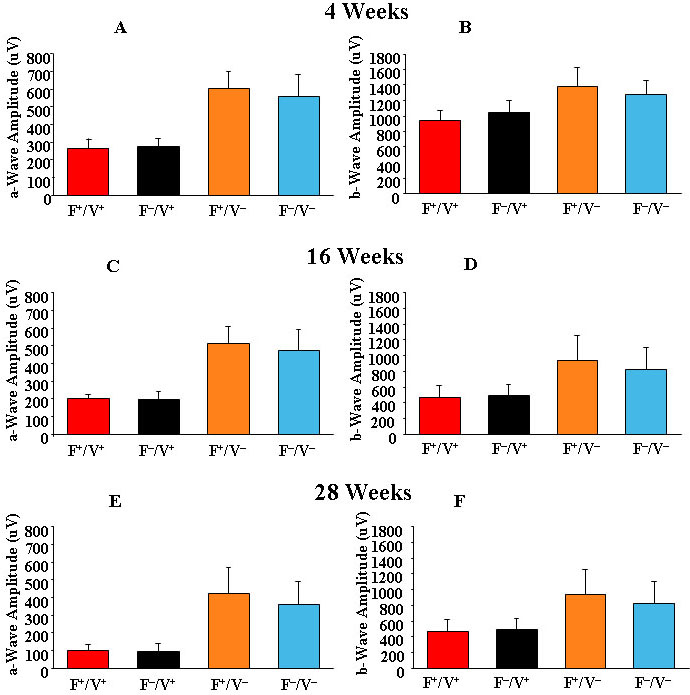
 Figure 6 of
Li, Mol Vis 2010; 16:1669-1679.
Figure 6 of
Li, Mol Vis 2010; 16:1669-1679.