Figure 2. Liver fatty acid composition. A: The relative mole percentage of n3 and n6 polyunsaturated fatty acids from total phospholipid extracts of liver of Fat1+/VPP+,
Fat1–/VPP+, Fat1+/VPP–, and Fat1–/VPP– mice are shown at 4 weeks of age. B: Relative mole percentages at 28 weeks of age are shown. (n=4–7) *p<0.05 fat-1 positive versus fat-1 negative. **p<0.01 fat-1 positive versus fat-1 negative. ***p<0.001 fat-1 positive versus fat-1 negative.
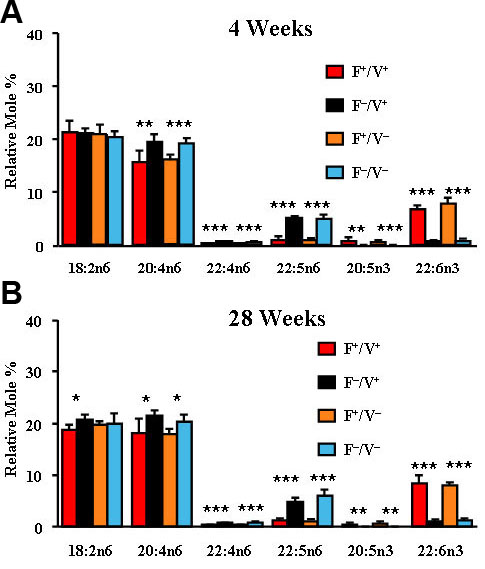
 Figure 2 of
Li, Mol Vis 2010; 16:1669-1679.
Figure 2 of
Li, Mol Vis 2010; 16:1669-1679.