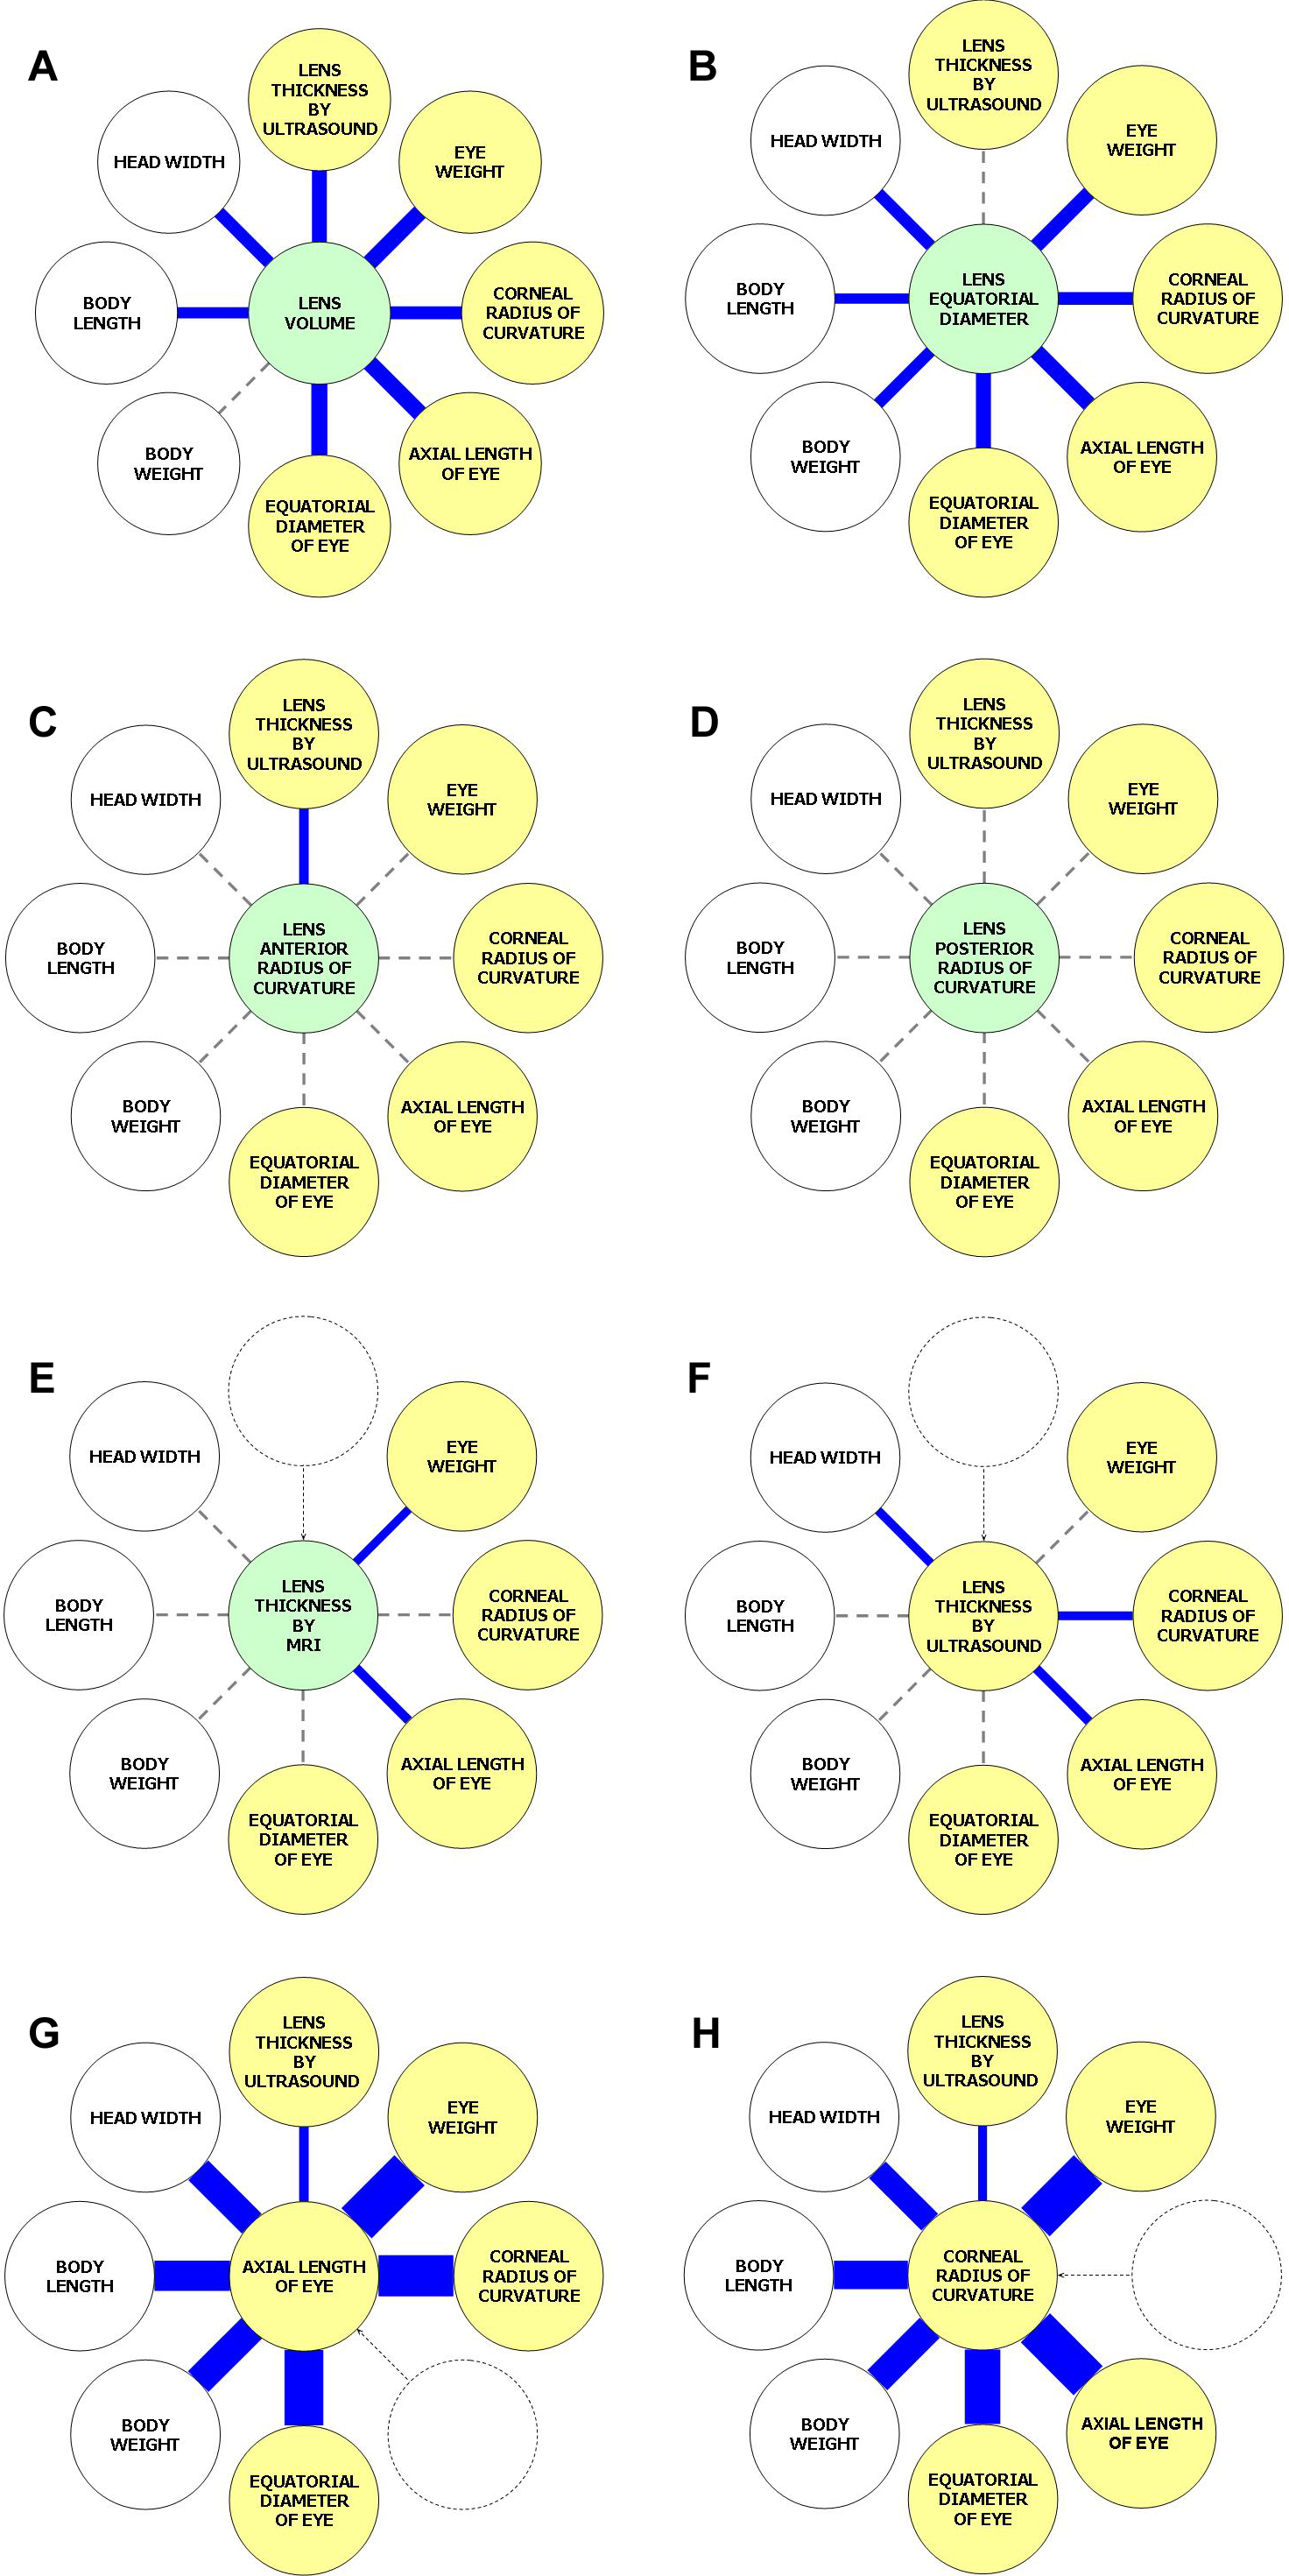
Figure 5. Illustration of significant
correlations between lens, eye and body size traits (for eyes with
lenses judged as non-kidney shaped). Panels
A-
H each
depict the degree of correlation between an individual trait (central
circle) and a range of other eye and body size traits (outer circles).
Significant correlations between traits are indicated by blue lines,
with thickness proportional to the magnitude of the correlation
coefficient. Results are shown for lens volume (
A), lens
equatorial diameter (
B), lens anterior radius of curvature (
C),
lens
posterior radius of curvature (
D), axial lens thickness
measured by magnetic resonance imaging (MRI) (
E), axial lens
thickness measured by ultrasonography (
F), axial eye length (
G),
and
corneal radius of curvature (
H). Ocular traits measured by
MRI are depicted as green circles, ocular traits measured by methods
other than MRI as yellow circles, and nonocular traits as white
circles. The data for panels
G and
H have been
published previously [
6]
and
are included here to provide a comparison between lens traits and
other ocular traits.
 Figure 5 of Tattersall, Mol Vis 2010; 16:144-153.