Figure 4. Comparison of axial lens
thickness measured using in vivo A-scan ultrasonography and ex vivo
magnetic resonance imaging. Panels A and B show scatter
plots of axial lens thickness measured using the two techniques, for
all lenses (A) and lenses judged subjectively to be nonkidney
shaped only (B). Panels C and D show frequency
distribution histograms of axial lens thickness for all lenses measured
using magnetic resonance imaging (MRI) (C) and ultrasound (D).
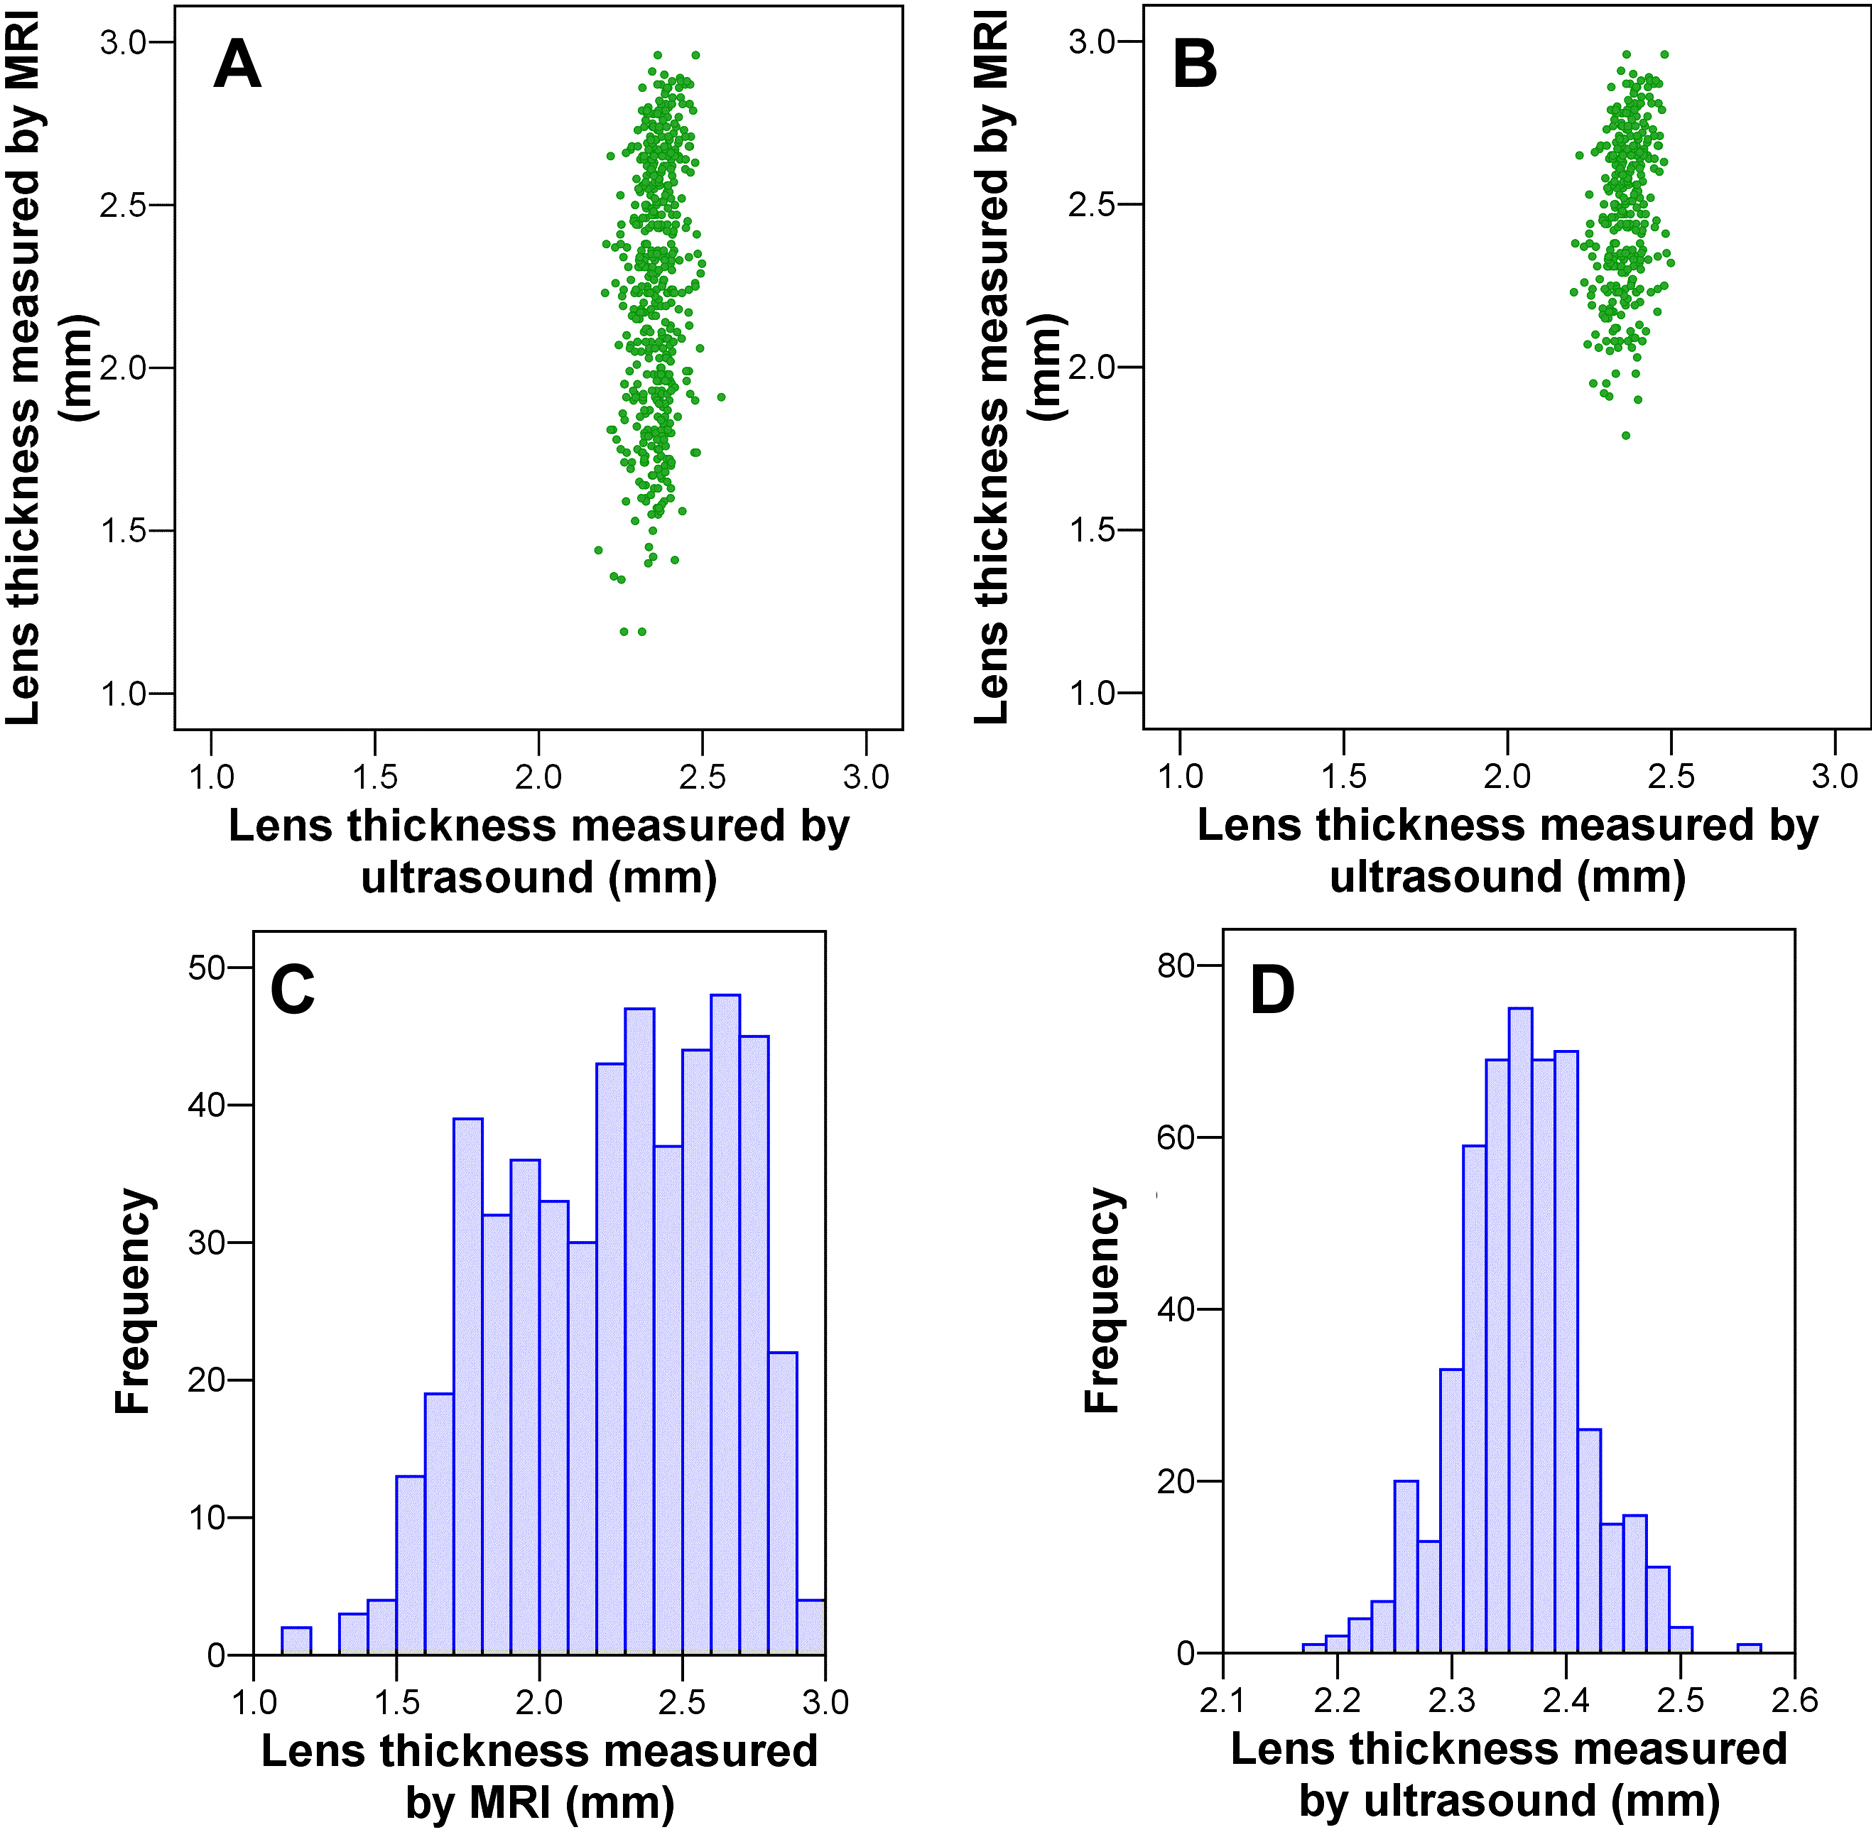
 Figure 4 of Tattersall, Mol Vis 2010; 16:144-153.