Figure 3. Frequency distributions of
crystalline lens surface curvatures obtained using magnetic resonance
imaging. Panels A-C show data for the anterior surface
radius of curvature. Panels D-F show data for the
posterior surface radius of curvature. Panels A and D
show data for all eyes. Panels B and E show data for
eyes judged subjectively to be nonkidney shaped. Panels C and F
show data for eyes judged to be kidney shaped. Note that the x-axis
scale
for panel A has been truncated to aid visualization. It
is apparent that the posterior surface radius is more normally
distributed than the anterior surface (the latter shows a greater
degree of skew).
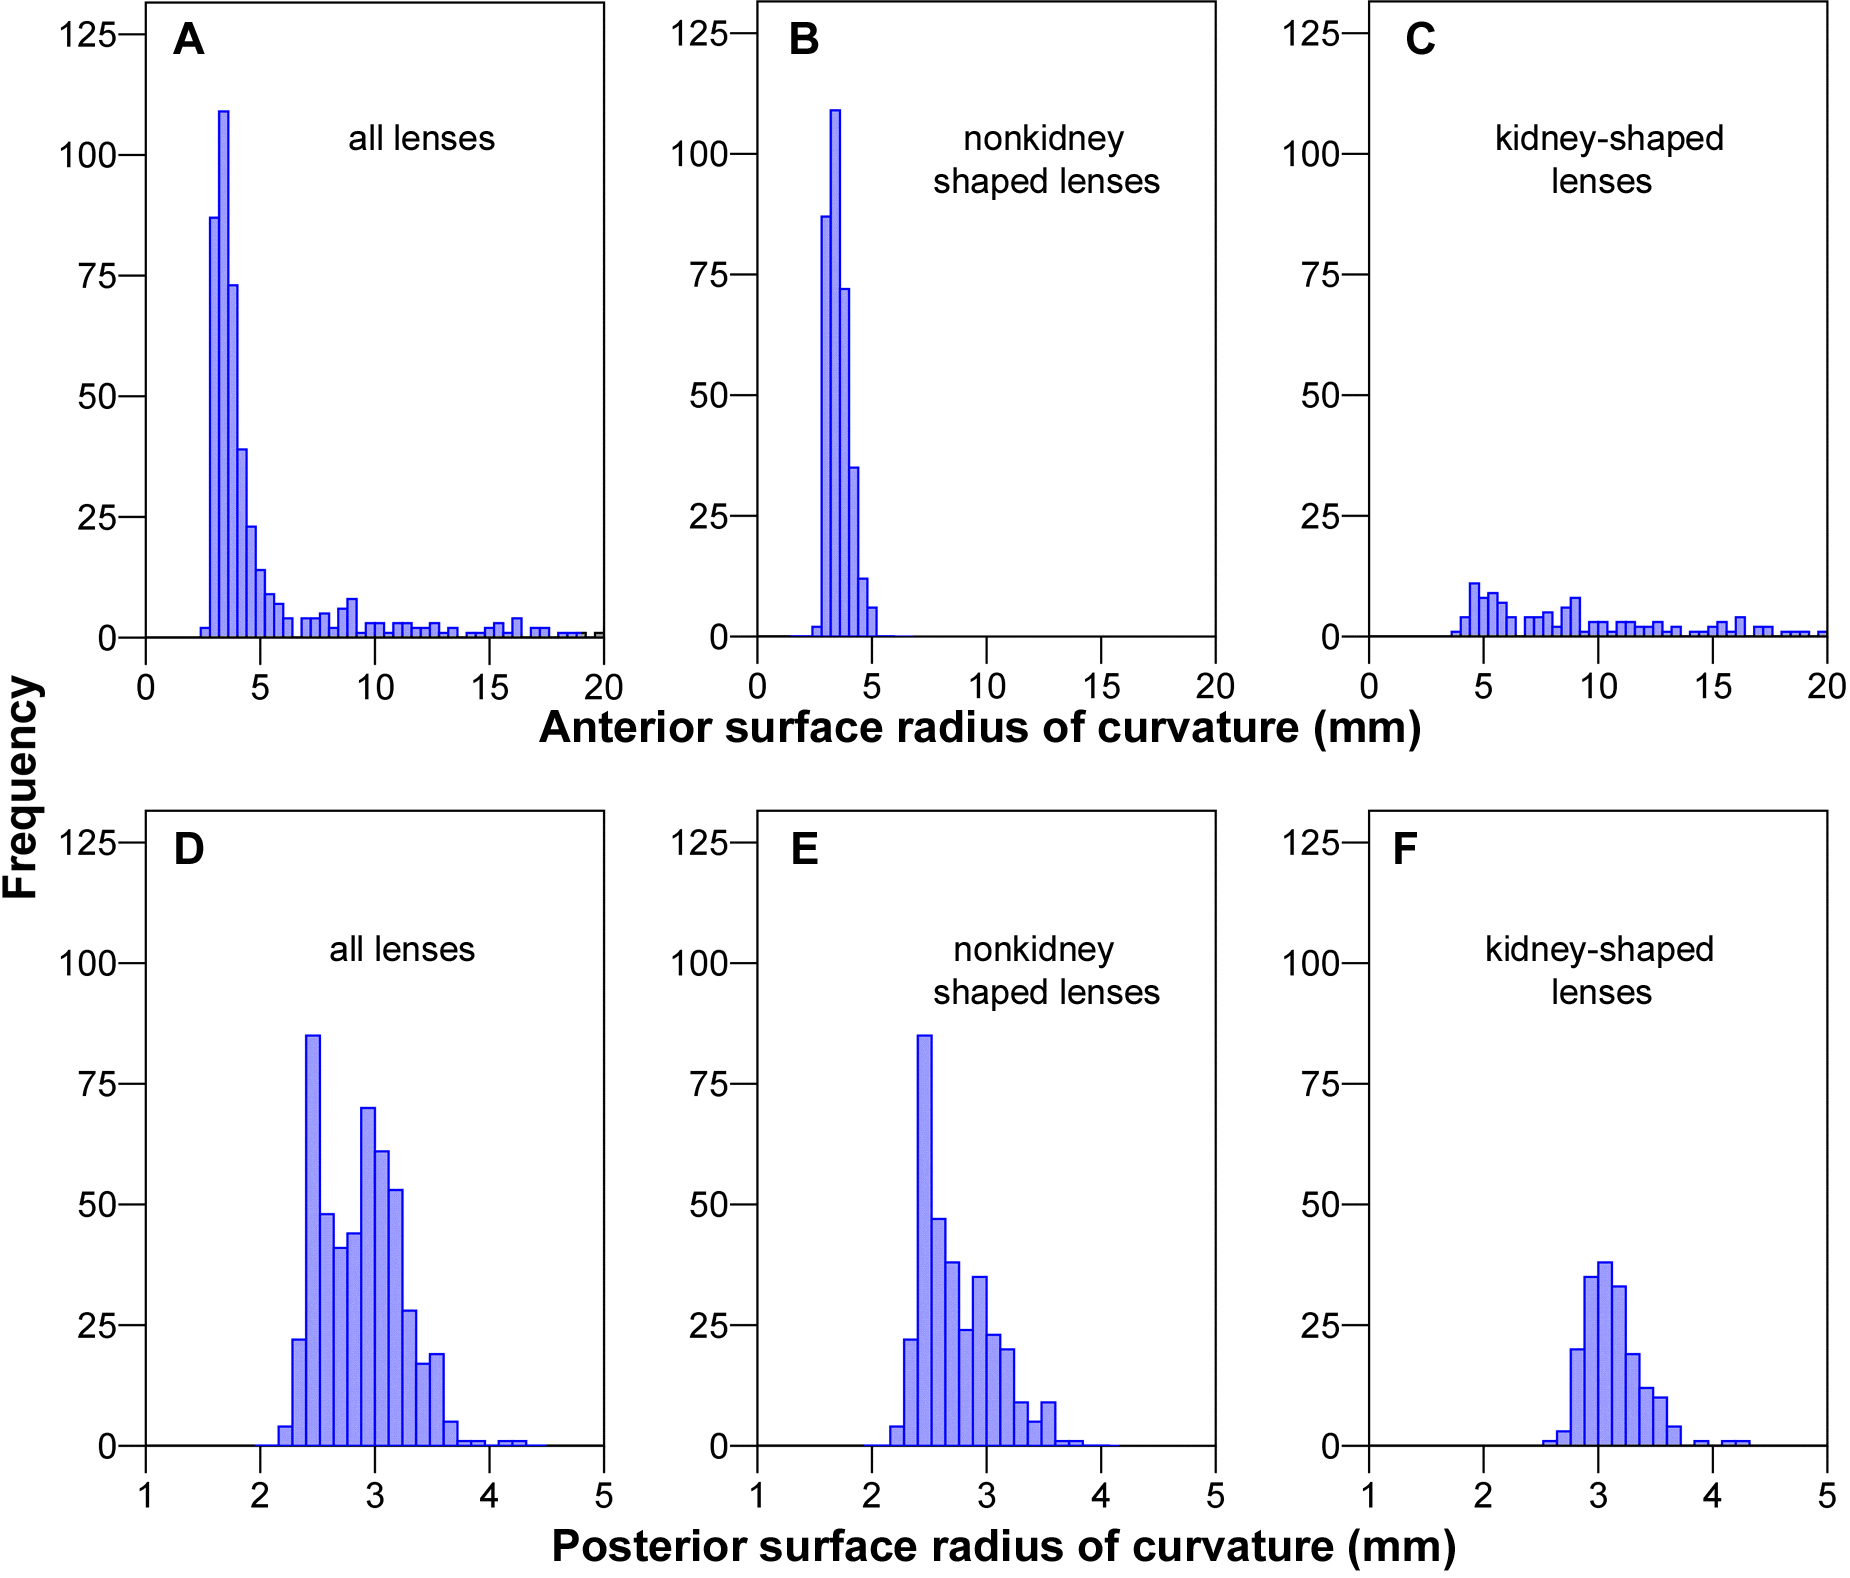
 Figure 3 of Tattersall, Mol Vis 2010; 16:144-153.