Figure 4. Mean level of mangiferin in rat blood after mangiferin administration (10, 25, and 50 mg/kg, i.v.). Data are expressed as
mean±SEM (n=6). The concentration-time data after a single intravenous administration of 10, 25, or 50 mg/kg showed that the
major parameters were correlated positively with the dosage given. The mean plasma concentration–time profile is illustrated
here.
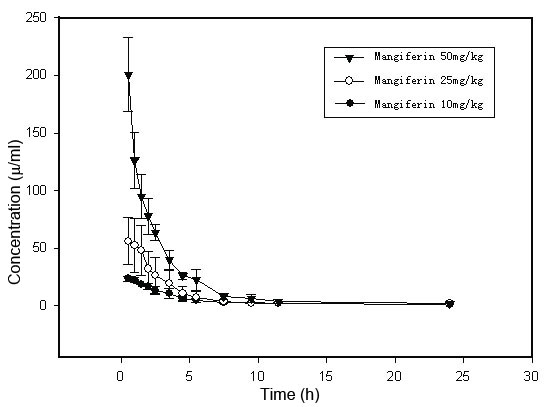
 Figure 4 of
Hou, Mol Vis 2010; 16:1659-1668.
Figure 4 of
Hou, Mol Vis 2010; 16:1659-1668.