Figure 2. The PAD2 and level of
deimination using ELISA analyses as described in methods. A and
B: PAD2 level represented by hollow bars and dotted bars for
control and glaucomatous donors. C and D: Level of
deimination are represented by hollow bars and dotted bars for control
and glaucomatous donors respectively. The results are standard
deviation of three independent experiments.
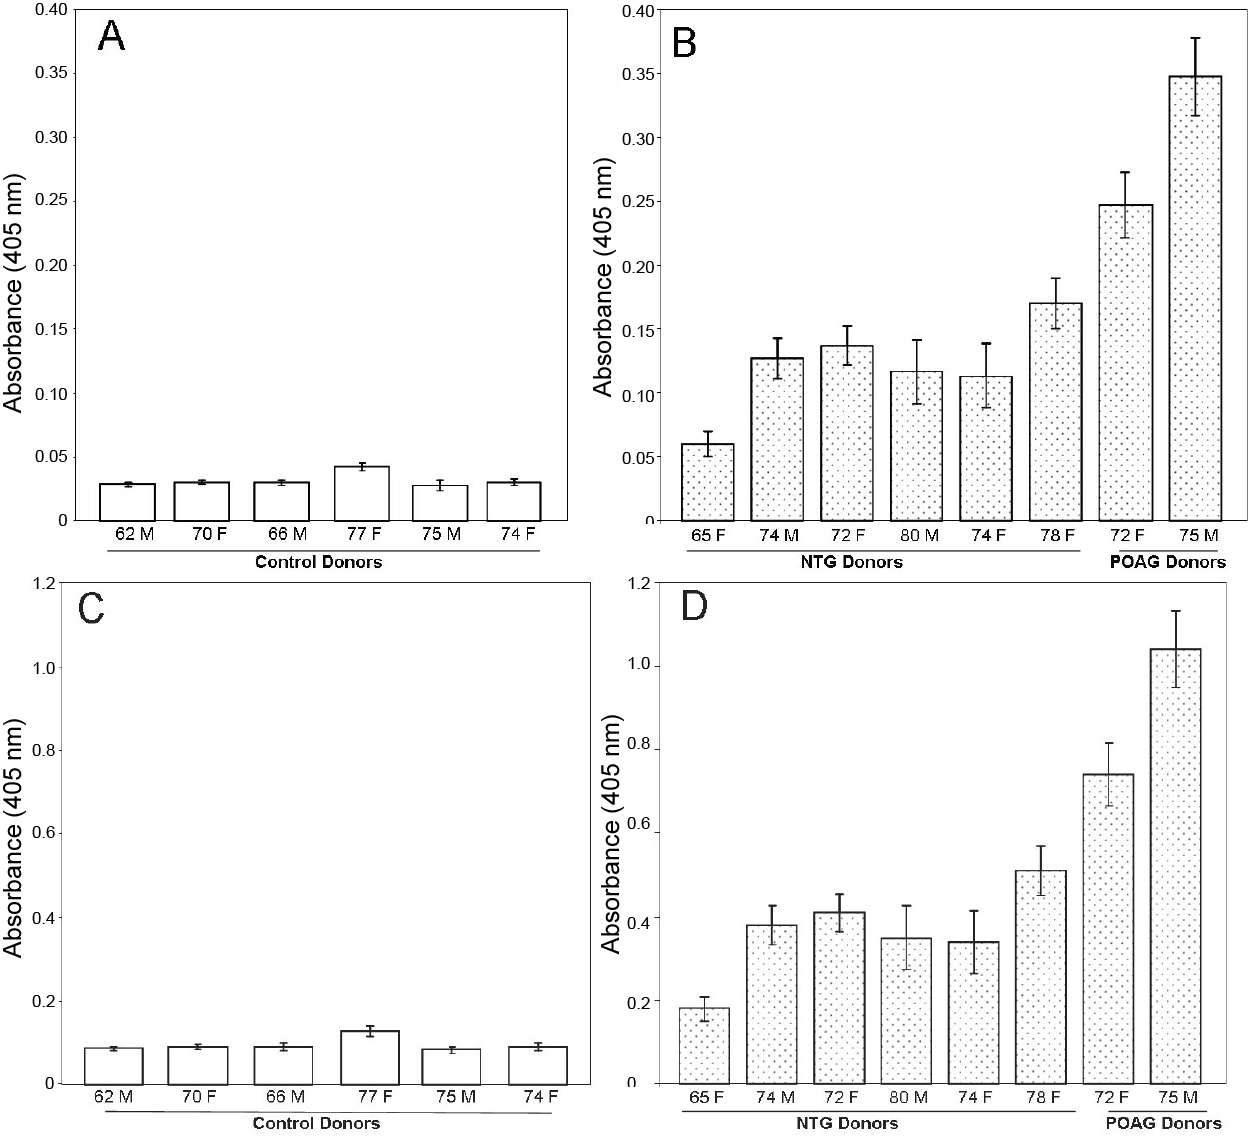
 Figure 2 of Cafaro, Mol Vis 2010; 16:1654-1658.