Figure 7. Expression of Fn in rLECs. Expression of Fn and β-actin are analyzed in panel A. The Fn expression is standardized by an internal control (anti-β-actin). Lanes M, 1, 2, 3, 4, and 5 are protein marker,
normal control, 0.1 ng/ml for 24 h, 0.1 ng/ml for 48 h, 10 ng/ml for 24 h, 10 ng/ml rapamycin for 48 h groups, respectively.
The summary results of Fn is shown in panel B. All differences were statistically significant (*p≤0.05).
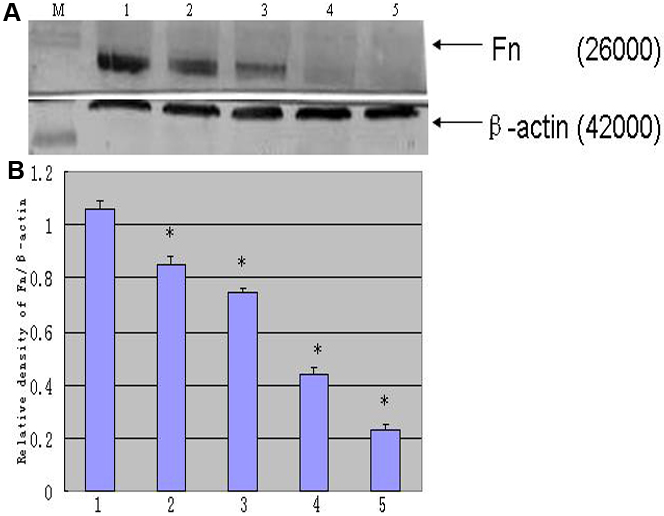
 Figure 7 of
Liu, Mol Vis 2010; 16:1646-1653.
Figure 7 of
Liu, Mol Vis 2010; 16:1646-1653.