Figure 4. The cell morphological
observation (100×) after hematoxylin and eosin (H&E) staining.
Panel A shows the control rLECs, while B, C,
and D shows 0.1, 1, 10 ng/ml rapamycin, respectively, after a
48 h exposure. Rapamycin had no effect on rLECs morphology treated with
different doses.
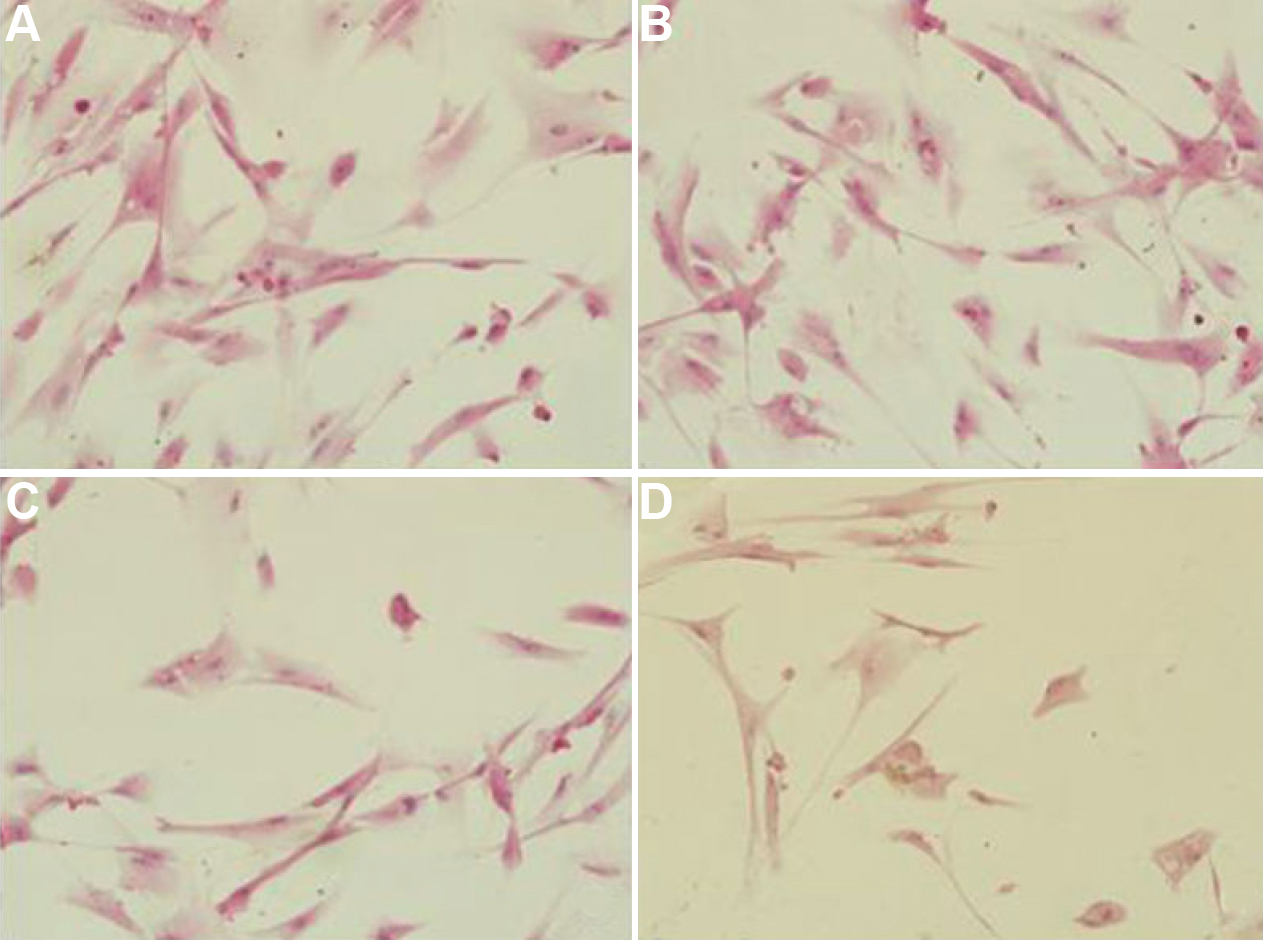
 Figure 4 of Liu, Mol Vis 2010; 16:1646-1653.