Figure 3. Immumofluorescence observation
(100×) of PCNA (oval green spots) in rLEC treated with different doses
of rapamycin. Panel A shows the control rLECs, while B,
C, and D shows 0.1, 1, 10 ng/ml rapamycin, respectively,
after a 24 h exposure. PCNA is clearly reduced in the rapamycin-treated
group. The histogram (E) summarizes the results of scanning
densitometry of PCNA. All differences were statistically significant,
*p≤0.05.
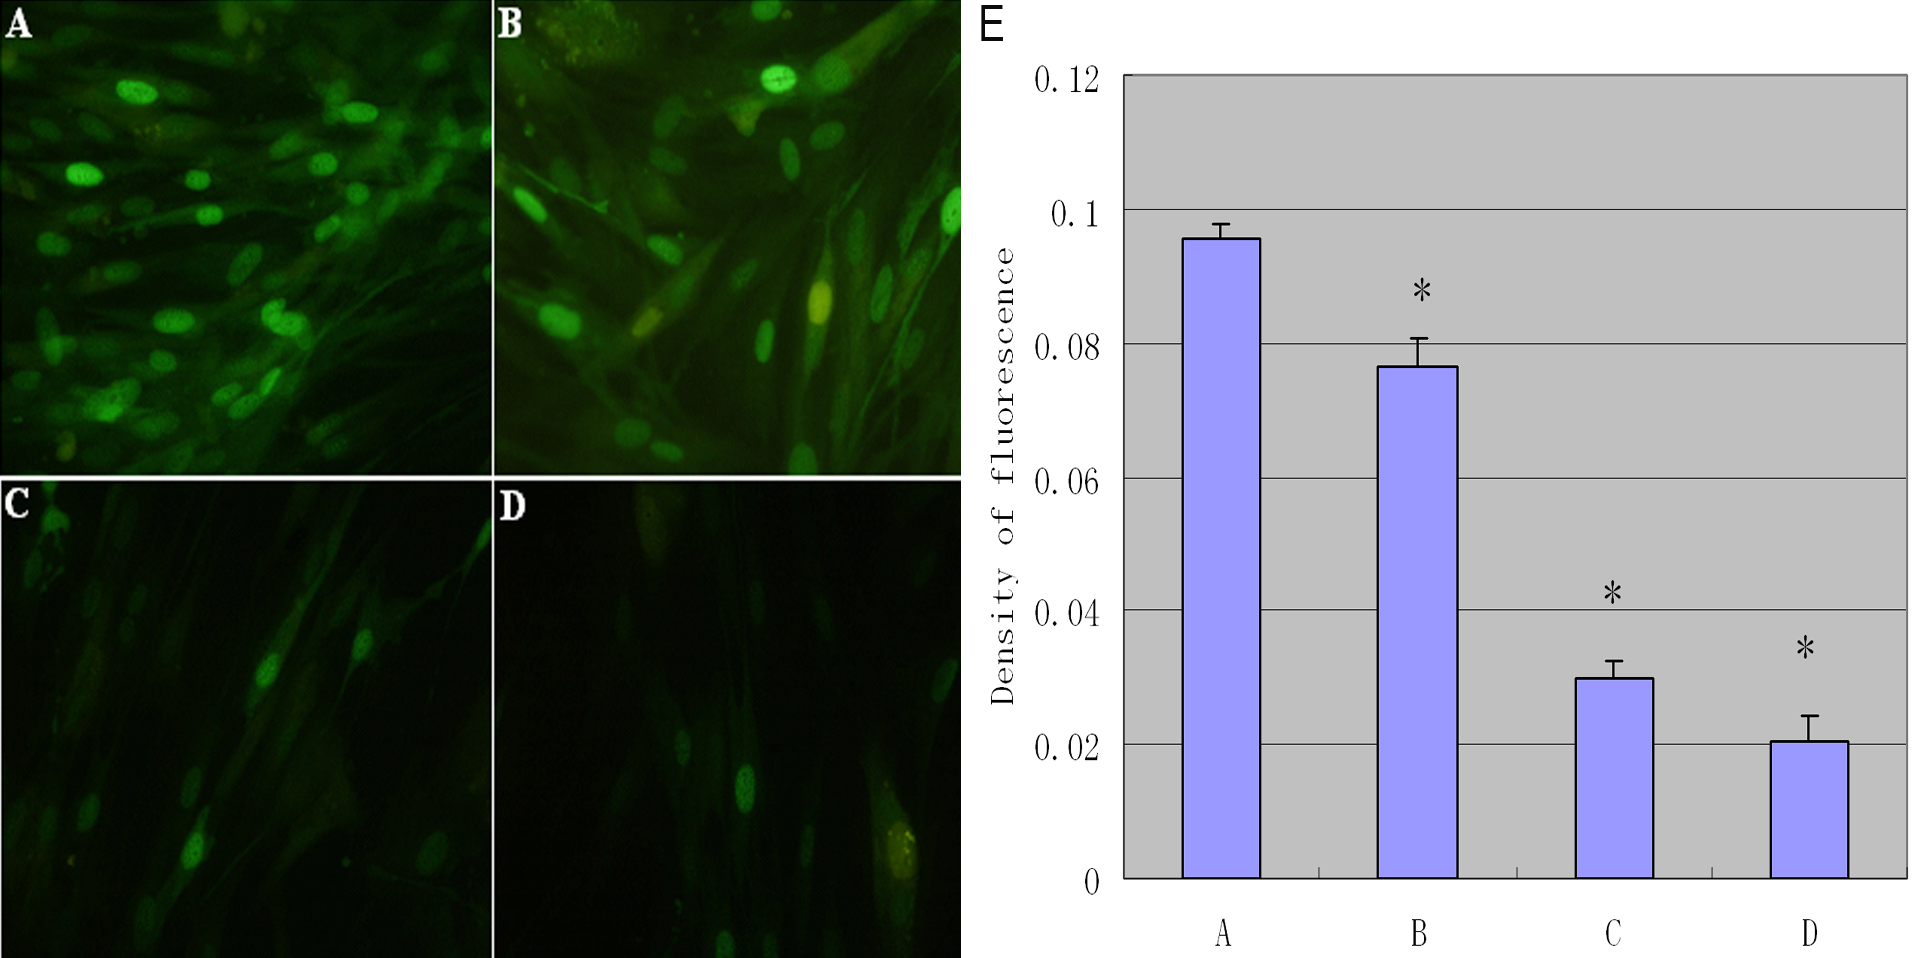
 Figure 3 of Liu, Mol Vis 2010; 16:1646-1653.