Figure 3. Diabetes of 4 months duration
reduced the latency of rod-mediated b-waves in Sprague Dawley and Lewis
strains, but not Wistar rats. Electroretinogram assessed responses to a
bright flash in diabetic rats (solid circles) or age-matched
nondiabetic controls (hollow circles). Peak amplitudes of rod mediated
a- and b-wave latency (A) and amplitude (B) are graphed
as a function of strobe flash intensity. Amplitude tended to be
subnormal in all 3 diabetic strains, but results achieved statistical
significance mainly at higher intensities. Group sizes were 5 for all
measurements. †p<0.05 by repeated measures test. *p<0.05 by t-test
between
nondiabetic and diabetic at specified flash intensity. Mean±SEM.
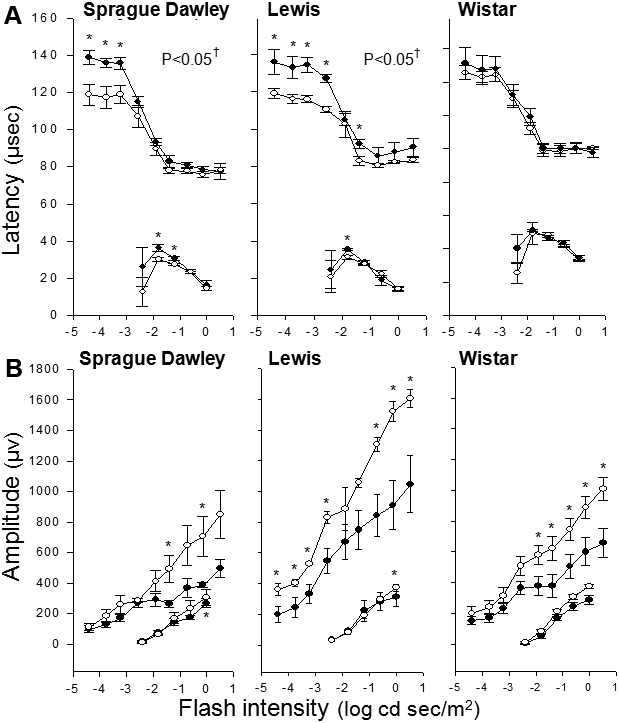
 Figure 3 of Kern, Mol Vis 2010; 16:1629-1639.