Figure 5. Comparison of the spatial and temporal distribution of AQP4 and Kir4.1 channel expression during the induction of refractive
compensation to optical defocus (using pixel intensity analysis of stained sections). Blue stars indicate significant differences
between the lens groups and/or control (No Lens) group (*p<0.05). Figures show the ratio mean luminance levels from the right
eye (experimental eye) compared to the fellow left eye. A is the mean ratio luminance levels for AQP4 in the nerve fiber layer (NFL), B is the mean ratio luminance levels for Kir4.1 in the inner plexiform layer (IPL), C is the mean ratio luminance levels for Kir4.1 in sublamina A in the IPL, and D is the mean ratio luminance levels for Kir4.1 in sublamina B in the IPL.
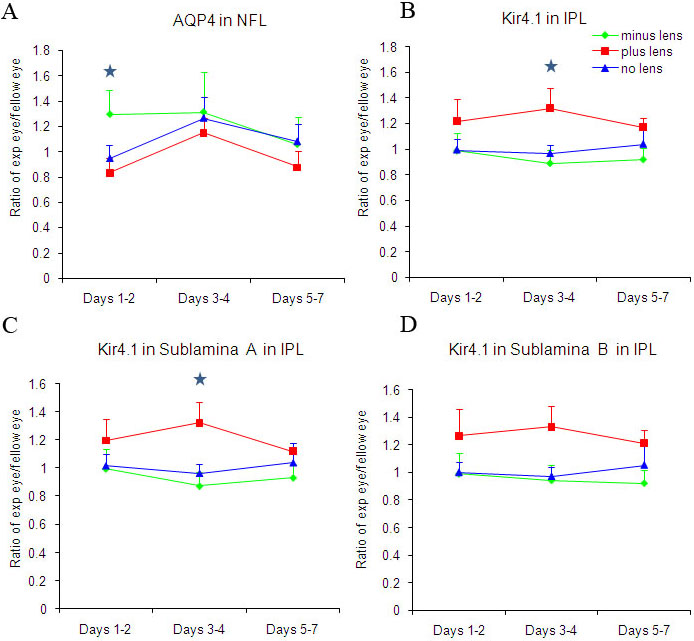
 Figure 5 of
Goodyear, Mol Vis 2010; 16:1610-1619.
Figure 5 of
Goodyear, Mol Vis 2010; 16:1610-1619.