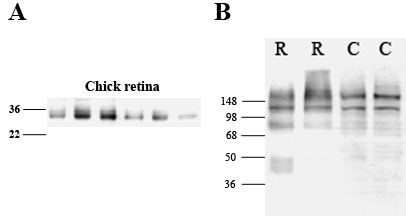
Figure 2. Western blot analyses of retinal
tissue demonstrating antibody specificity to aquaporin water channels
(AQP4; A) and Kir4.1 (B) in rat (R) and chick (C) retina.
A:
For AQP4, the appearance of bands between 30 and 32 kDa represents
the estimated size of AQP4 in the chick eye [
15].
B: For Kir4.1, bands were present
in both normal rat and chick at approximately 85 kDa, representing
the dimeric form of Kir4.1. Additional bands were also seen at
approximately 200 kDa, which were presumed to represent the
tetrameric form of Kir4.1 [
24,
33].
The lanes
correspond to retinal tissue from normal chicks.
 Figure 2 of Goodyear, Mol Vis 2010; 16:1610-1619.