Figure 5. Image analysis to detect expression differences of the individual AGE modified protein spot between the groups. Only the spots
showing significant differences were included in the figure table. No significant differences were detected between DNR and
DR groups.
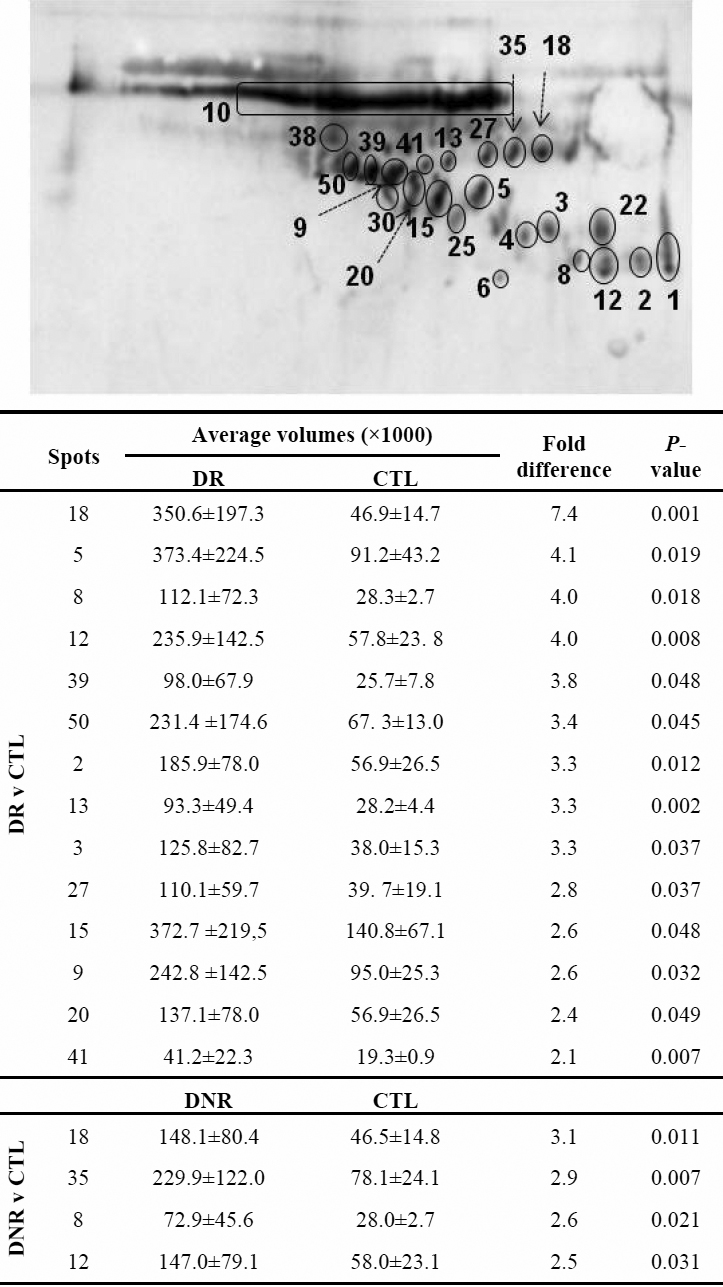
 Figure 5 of
Zhao, Mol Vis 2010; 16:1576-1584.
Figure 5 of
Zhao, Mol Vis 2010; 16:1576-1584.